Q4 2025 Review
Doge initiatives, ‘Liberation Day’, tariffs, and the Government shutdown dominated headlines in 2025. President Donald Trump’s tariff announcements on April 2nd drove economic policy uncertainty to extreme levels, unsettling markets and economies worldwide. While equities rebounded from lows in April, the response in the bond market has been notably different. The Federal Reserve has continued the easing cycle that began in September 2024, leading to a rally in Treasuries out to roughly 7 years. On the long end, however, yields remain elevated as the bond market continues to be concerned about inflation risk, fiscal policy, and a rising term premium. See below
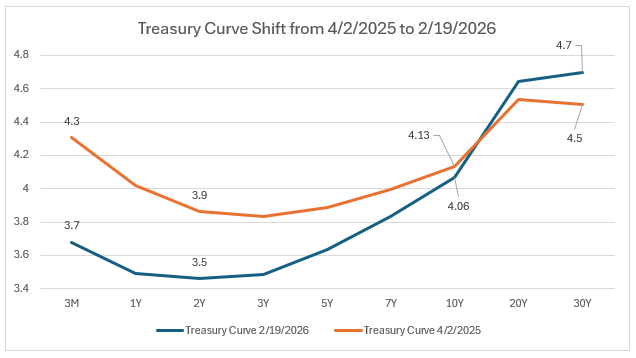
Source: Bloomberg
5 Themes Shaping 2026
1. Does the Transition from Powell to Warsh Go Well?
As Jerome Powell’s term concludes on May 15th, the Federal Reserve enters a period of transition following several years of visible policy tension with Donald Trump. The relationship has often been strained, with disagreements over policy direction frequently playing out in the headlines. Trump has recently nominated Kevin Warsh to succeed Powell and markets will be watching closely to see how much influence he has over the rest of the committee to get what the administration ultimately wants – lower rates. For the January meeting, the Fed Funds Rate (below) remained steady after 175 basis points of cuts over the past 15 months. How many cuts will there be in 2026? It seems Powell is on cruise control until he rolls off, and we believe it would be prudent to be patient for a time as monetary policy has long and variable lags.
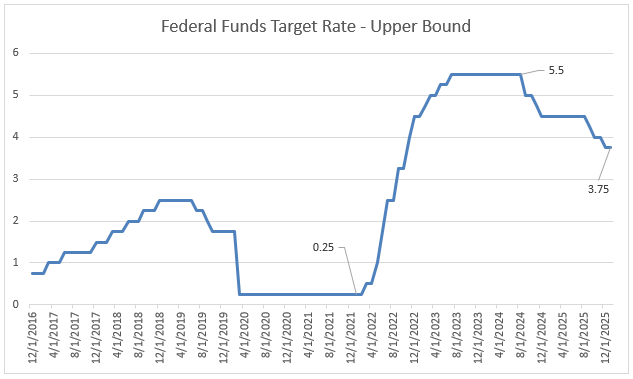
Source: Bloomberg
2. Will There Be Any Unforeseen Geopolitical Shocks?
Since 2020, the global backdrop has been shaped by an extraordinary sequence of events, including the COVID-19 pandemic, Brexit, the U.S. withdrawal from Afghanistan, Russia’s invasion of Ukraine, global supply-chain disruptions, an historic surge in inflation, the Israel–Hamas war, and successive rounds of U.S. tariffs. Already in 2026, markets have been forced to digest new geopolitical shocks, including the capture of Venezuela’s president as well as renewed rhetoric from Donald Trump regarding Greenland. According to Google Trends (below), interest in Greenland has reached its highest level since the platform’s inception. While future headlines remain uncertain, we do know there will be shifts globally in one form or another.
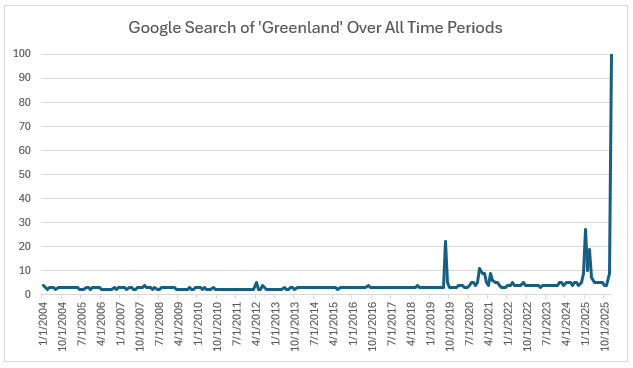
Source: Google Trends
3. Is inflation truly on a sustainable path back to the 2% target?
Jerome Powell intimated that inflation has remained sticky because of a one-time shock from tariffs. The Fed has remained confident that we will see more disinflation, giving a loose timeline that it will tick down noticeably during Q2 of 2026. Will this end up coming to fruition? Core PCE – the Fed’s preferred inflation gauge to the right – has been roughly at 2.8% for over 20 months. We will know if Powell’s prediction is true within 6 months.
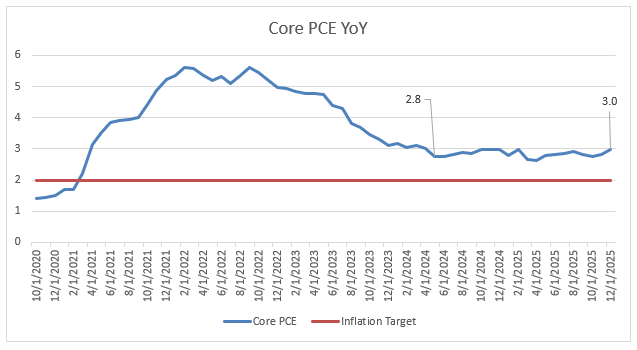
Source: Bloomberg
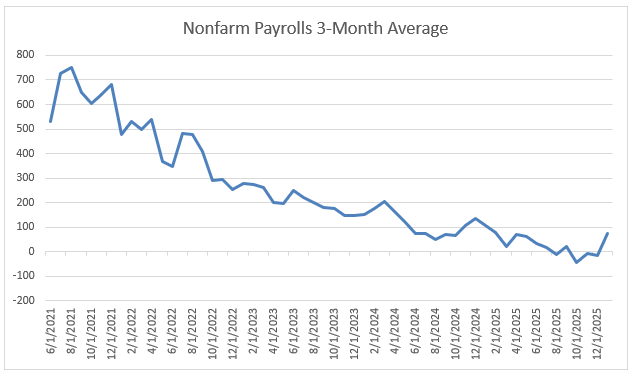
4. Are the Jobs Numbers Trustworthy?
The Fed has been more aggressive with rate cuts as the labor market has weakened. Nonfarm Payrolls (below) has been in a downward trend since the end of Covid-19. Chairman Powell recently acknowledged concerns that payroll figures may have been consistently overstated by approximately 60,000 jobs. In an environment where economic data has frequently been revised, this raises important questions about underlying labor strength. If employment has been overstated, it would help reconcile the Fed’s willingness to ease policy even while inflation pressures persist.
Source: Bloomberg
5. Will the consumer remain resilient?
Much has been made of the ‘K-Shaped’ economy over the past year, where the higher-end consumer is thriving and the lower-end consumer is facing mounting financial pressure. These 2 charts below illustrate this well. Money printing in response to COVID padded the pockets of the wealthy leading to nearly $8 trillion in money market funds. This money eased the pain briefly for the lower-end consumer, but we are now back to near record levels of credit card and auto loan delinquencies. Whether the lower-end consumer can remain resilient may be the most important economic question ahead of us.
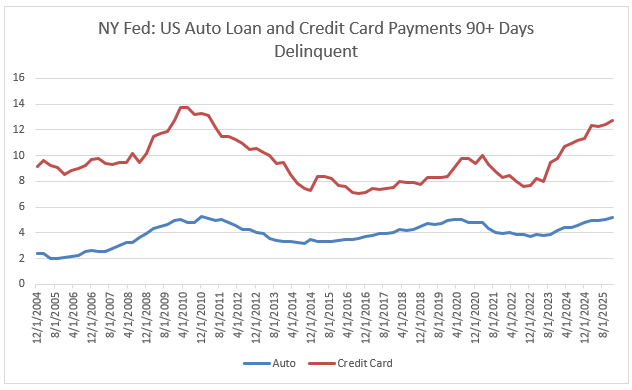
Source: NY Federal Reserve
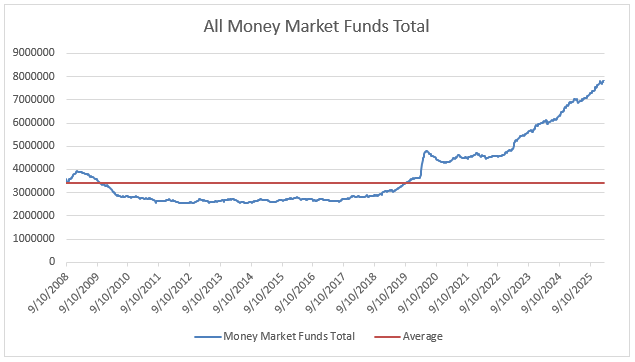
Source: Investment Company Institute
Munis: Demographic Credit Metrics
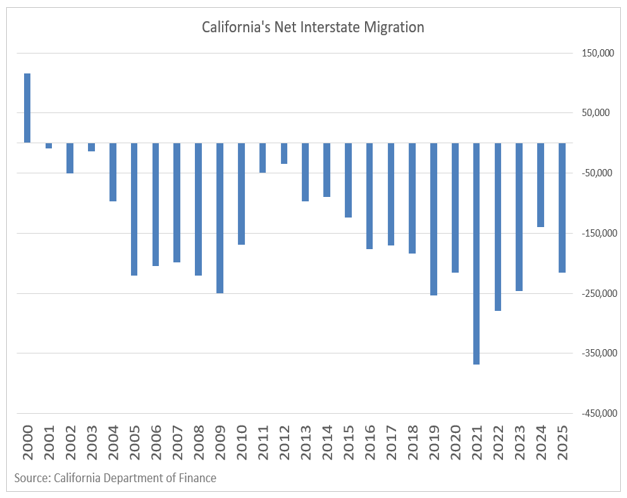
CA and Out-Migration
For 25 consecutive years, California -as seen below - has experienced negative net migration driven largely by housing affordability challenges and increased remote-work flexibility. This sustained out-migration has pressured several sectors, most notably education, where enrollment has declined across nearly all counties. The problem with out-migration is that when people leave a state there are then fewer people to service existing levels of debt. Detroit is an extreme example of a city which suffered from people moving away. Detroit had a population of 1,850,000 in 1950 and was forced into bankruptcy in 2013 when the population dwindled down to less than 650,000.
Out-migration can have a meaningful impact on the credit quality of a state or city. The table below shows the 5 states that have experienced large outflows during the past year.
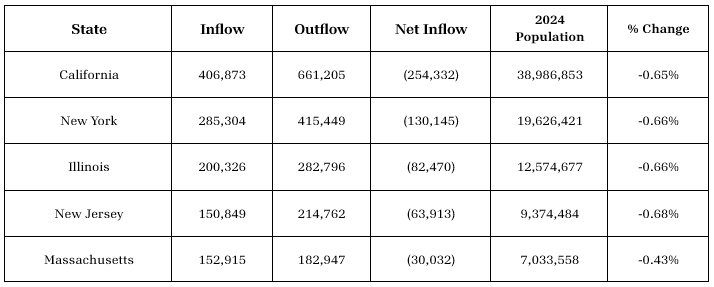
The states with the biggest in-migration patterns are Texas, Florida, North Carolina, Arizona, South Carolina, and Nevada. While the trends in migration patterns are not currently alarming, we still monitor them as a sign of the economic health of our communities. We still also really like schools as credits in client’s portfolios. We remain selective with certain cities/states but overall believe they have great public purpose and are viewed favorably by taxpayers.
Birth Rates
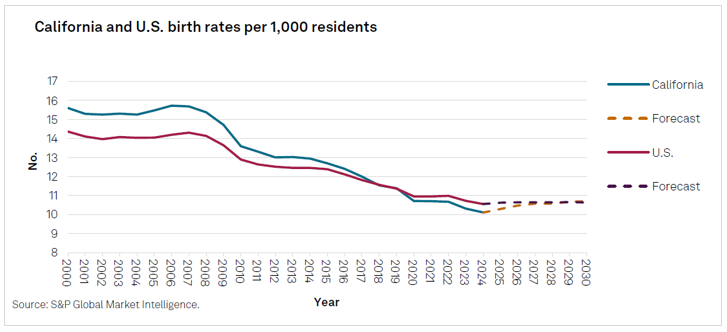
Another demographic trend we monitor that may have an impact on Municipal credits is birth rates. Birth rates have been declining for several years, and this affects school systems for K-12 as well as higher education. The S&P report below highlights this trend, comparing U.S. and California birth rates since 2000. Lower birth rates translate into declining student enrollment, placing financial pressure on local school districts and potentially leading to future school closures. In California, K-12 enrollment has declined approximately 3% over the past five years, and S&P projects an additional 10% decline over the next decade.
High School Graduation Rates
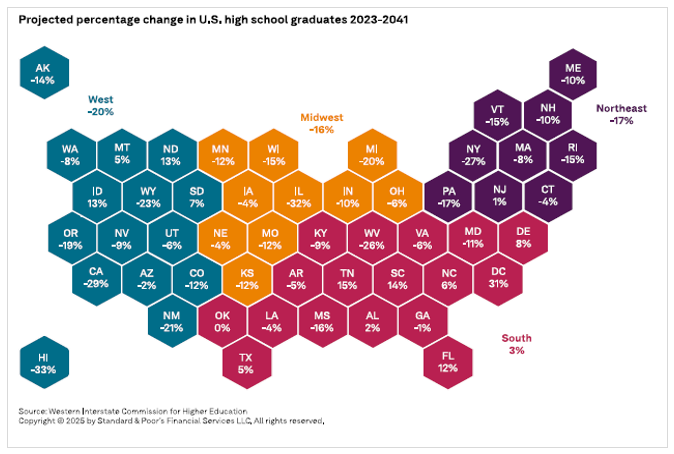
High School graduation rates are also declining and expected to continue falling for the next 15 years. This creates a demand problem for the higher education sector. The chart below from S&P shows the projected change in graduation rates through 2041 for all states. For example, the number of graduates in CA may decline by about 29% over this time. Competition for students is intense, and operating expenses have increased, creating budget pressures for this sector. Many small private high-tuition liberal arts colleges have already closed their doors. We expect this trend to continue and avoid smaller schools in this sector.
Conclusion
The year ahead presents no shortage of moving parts: a Fed leadership transition, persistent inflation questions, global political risks, and demographic shifts affecting local tax bases. Markets will continue to adjust to each headline, particularly on the long end of the curve where fiscal concerns and term premium remain elevated.
Despite these crosscurrents, we believe the municipal market remains fundamentally sound. States and many local governments retain solid reserves, and essential-service credits continue to demonstrate resilience. Careful credit selection and a balanced approach to duration will remain key as we navigate what is likely to be another dynamic year for fixed-income investors.