
Q2 2026 Review
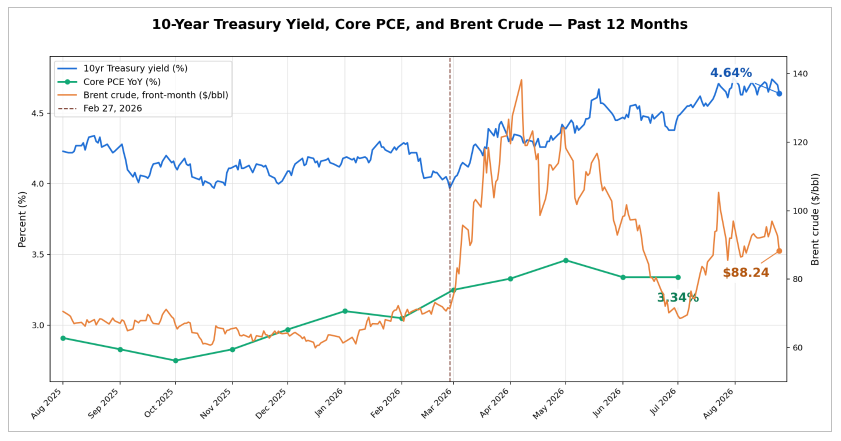
The on-again, off-again conflict with Iran has now continued for nearly 6 months. President Trump has seemingly underestimated the resolve of Iran putting himself in a difficult position in negotiations. While he literally wrote the book on ‘the art of the deal’, finding common ground for a final deal has remained elusive. Since fighting began, the economy has remained strong even with more volatile oil prices. Bond yields have risen as investors are demanding more yield with rising global uncertainty. As the moves show below since February 27th when fighting began, the 10-Year Treasury has jumped from 3.97% to 4.65% (68 bp’s) as more rate cuts have been fully priced out. Headline and Core PCE have risen and, of course, oil has taken wild swings – now up 24% since the start of the conflict.
Source: Bloomberg
Kevin Warsh’s Sluggish Start
Kevin Warsh was sworn in on May 22, 2026. Nominated by President Trump and appointed by the Senate, they had high hopes he would be able to continue lowering the Federal Funds rate. So far, things have not gone as planned. Markets have moved from pricing cuts to debating the timing of the next hike. While nonfarm payrolls have not been as strong in 2026, Warsh has clearly communicated that the jobs market is not something they are concerned about at the moment. That raises the obvious question: if full employment isn't a concern, and inflation has run above target for over five years, what's actually stopping the Fed from beginning to raise rates? Maybe we will get more direction from Mr. Warsh during his first Jackson Hole speech.
Let the Markets Speak
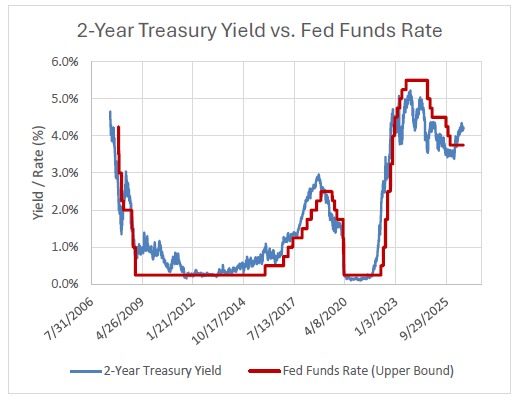
At the most recent press conference, Warsh said, “Market participants are learning to play the ball, not the referee — and market prices will continue to respond in the direction and magnitude they see fit…What I've really been trying to do... (I am) getting an unfiltered message from markets.” He wants to watch the markets for guidance more than the previous Fed Chairman communicated. The 2-Year Treasury – often seen as the cleanest read on where the Fed Funds Rate is headed - began to rise on 2.27.2026 and had continued its upward trend (below). If he is looking for a message from the markets, they seem to be speaking.
Source: Bloomberg
What is Driving Persistent Inflation?
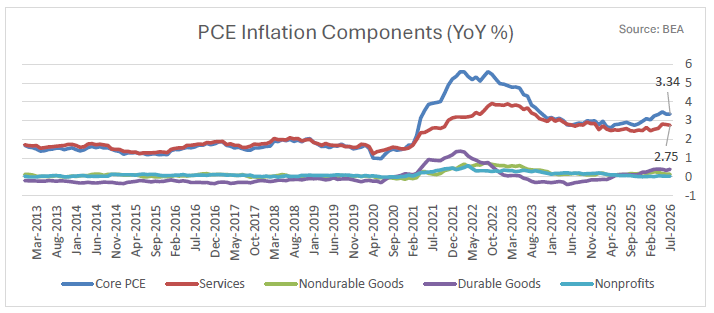
Many things are keeping rates elevated – the conflict with Iran, U.S. Government debt levels hitting $40 Trillion and continual deficits, and stubborn inflation. But what are the underlying data points of the persistent inflation we have seen since 2021? Core PCE inflation components, seen below, show services inflation averaged 1.65% from 2012 – 2021. From 2021 to today, the services inflation component has averaged 2.93%. That’s almost double. Inside services inflation is health care, financial services, housing and utilities, food service and more. This means that Services inflation makes up 82% Core PCE. How does this number come down? Without economic weakness, it could potentially take years.
Things We Are Watching…
The Yen Carry Trade Unwind
During the last several years U.S treasury rates were significantly higher than those for the JGB. This led to an arbitrage trade where investors would borrow in ultra-low yielding Japanese yen and convert the proceeds into dollars to purchase higher yielding U.S. treasuries and corporate credits. This is known as the carry trade. This has led to the Japanese carry trade being the biggest buyer of US treasury bonds.
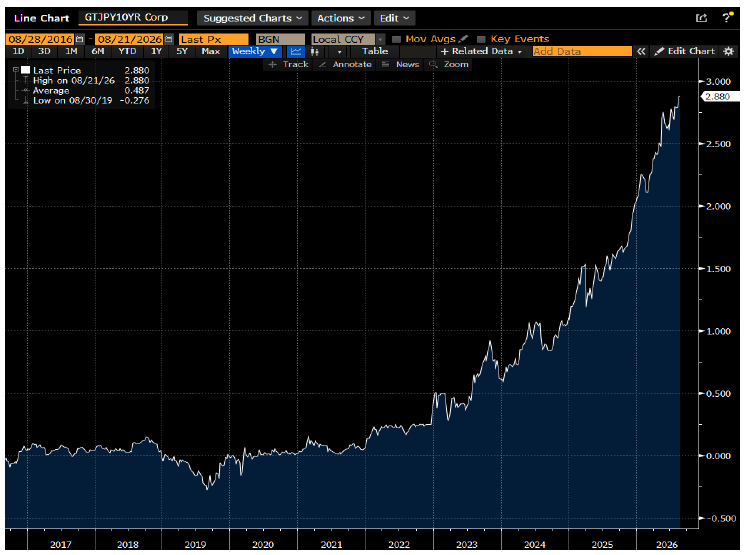
During the last couple of years, JGB yields have risen sharply from negative yields to about 2.90%. This is shown in the chart below. This has led to some unwinding of the carry trade which has reduced the demand for treasury securities. We are monitoring this to see what additional impact it might have on treasury yields and the shape of the yield curve.
Source: Bloomberg
Debt Financing for AI Data Centers
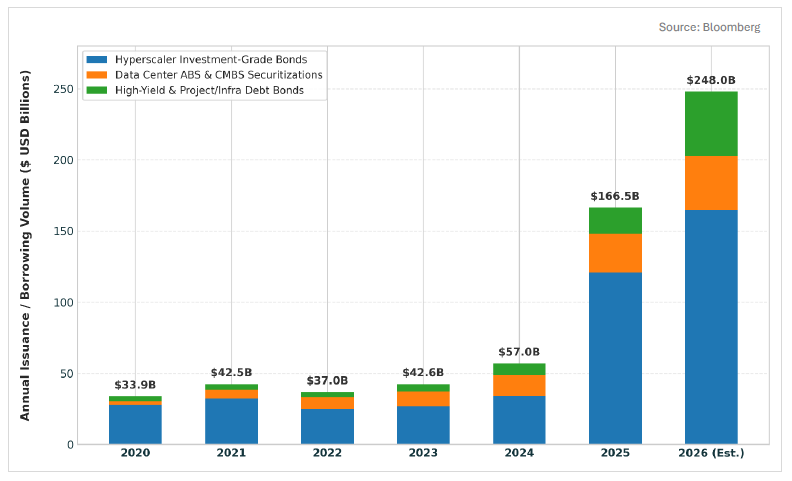
While there is much discussion about AI and how it is going to change our world, we are watching the incredible increase in borrowing to pay for these projects. The chart below shows the growth in borrowing since 2020. Many of these loans are for periods from 5-30 years. We have not participated in investing in this type of debt because it does not meet our risk parameters. We are watching this trend as yield spreads continue to widen as these firms are rapidly becoming less creditworthy. For example, Oracle has gone from an A-rated credit in 2020 to BBB- today. This trend may continue and we are monitoring it closely.
U.S. Treasury Debt Management Strategy
U.S. Secretary of the Treasury Scott Bessent recently announced a new treasury debt management strategy. The treasury will perform its own version of an “Operation Twist”. They will issue short term debt to buy long term UST. The plan is to alter the maturity structure of outstanding treasury debt. This is being done to flatten the yield curve since short term rates are lower than long rates. We will be monitoring this closely. We are concerned about rollover risk with the short maturities and the inflationary impact of repression of long-term interest rates while running unsustainable budget deficits.
Improving Portfolios With Shifting Rates
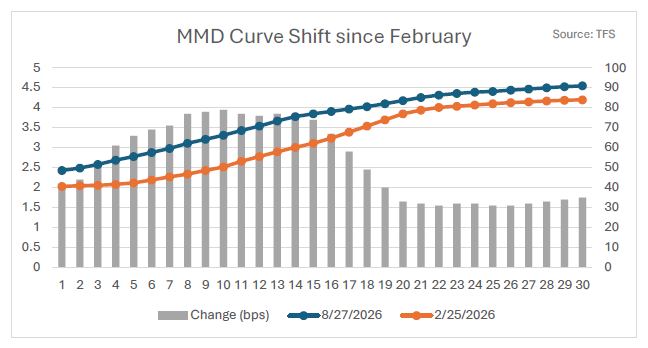
The chart above shows the shifts in the MMD curve since the conflict began in Iran and how rates continue to rise. Our job as portfolio managers is to take advantage of any situation and look for ways to improve our portfolios for the benefit of our clients. We have done this in multiple ways over the past 6 months.
Tax-Loss Harvesting – Yields have risen across the entire curve – and over 70 basis points in years 2033-2041. This gives us the opportunity to buy similar – but not identical – bonds to bank the loss for the client while maintaining a similar structure in the portfolio.
Increasing Credit Quality – While yields have remained elevated for months, it has given us a chance to be patient and increase overall credit quality. Almost everything we have purchased long in 2026 is AA-wrapped with insurance or AAA bonds.
Increasing Overall Portfolio Yield – While increasing quality, we have also been able to increase overall yields in portfolios. When harvesting losses, we are selling bonds yielding 4.30 – 4.50% and re-investing in tax-free yields of 4.60 – 5.00%.
Buying Higher Coupons – The rise in rates has also given us the chance to increase client’s overall average coupon. This allows us to shorten duration, decrease volatility in the portfolio and increase income for the client.
Conclusion
Rising rates and heightened geopolitical uncertainty have created opportunities for our clients this quarter. We've used the volatility to harvest tax losses, shift portfolios toward even higher-quality bonds, and lock in more attractive yields and coupons. We will continue to monitor the global economy, corporate debt issuance, and the Treasury’s new debt management strategy for downstream effects on rates.