Q2 2025 Review
The U.S. Economic Policy Uncertainty Composite draws on the frequency of media mentions of policy uncertainty and disagreement among economic forecasts of inflation and government expenditure. This composite surged to record highs - eclipsing levels seen during past market crashes and the COVID era. Markets reacted sharply to “Liberation Day” on April 2nd, as newly announced tariffs triggered fears of trade wars, sending stocks lower and yields higher. Geopolitical tensions escalated as well, with rising conflicts involving Iran, Israel, and the U.S., prompting greater caution from corporate leadership as inflation risks remain tied to global trade dynamics.
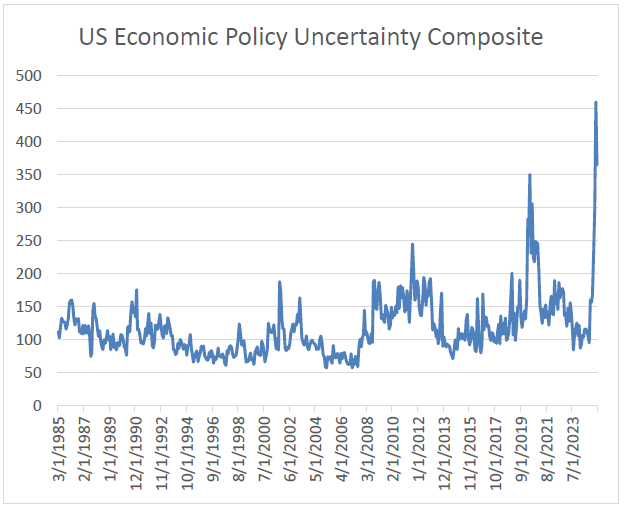
Source: Bloomberg
The chart below shows how the Federal Reserve has more control over the short end of the Treasury curve than out longer. The red line is the Treasury curve as of 9/17/2024 when the Fed began lowering the Fed Funds rate 100 basis points over a 3-month period. The green line is the curve today. The 3-Month T-Bill yield fell 55 basis points. But, out longer, the 10-Year Treasury has risen 64 basis points, and the 30-Year Treasury has risen 87 basis points. We believe this is because the bond market has more of a focus on fiscal policies and the ballooning national debt. Trump and Powell want to lower the Fed Funds Rate but that is not a guarantee that rates will fall. We believe we need to see more fiscal responsibility before rates can fall.
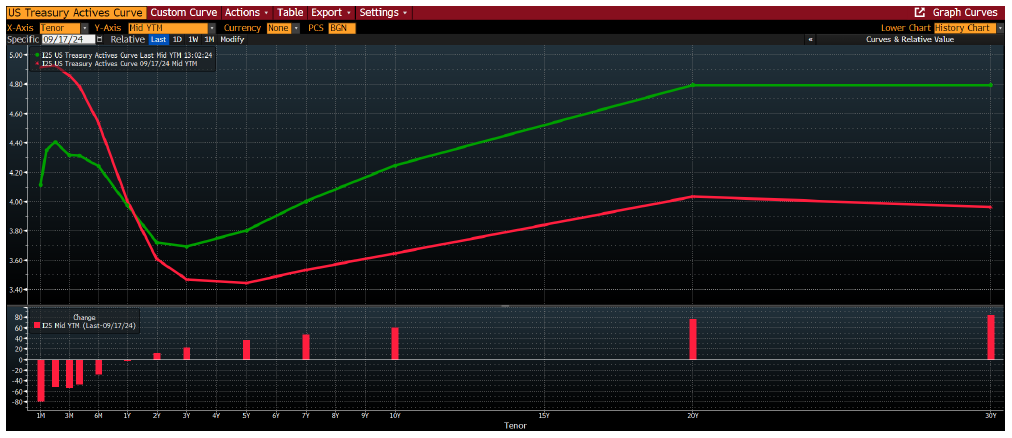
Source: Bloomberg
The Case for Munis Amid Fiscal Reckoning
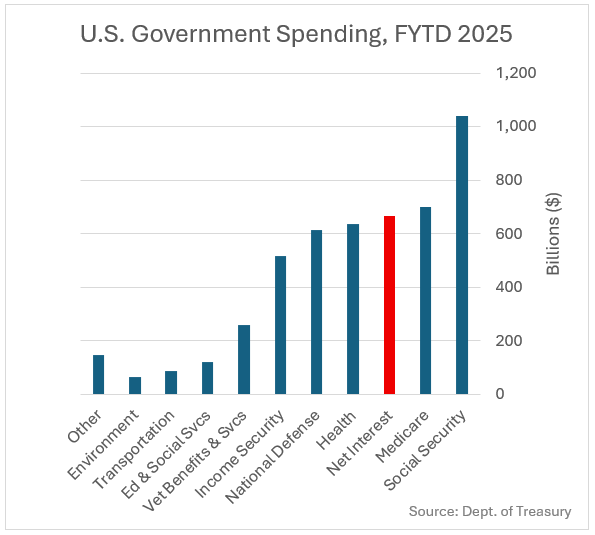
As federal debt levels surge past $35 trillion, policymakers on both sides of the aisle are being forced to confront long-term fiscal sustainability as it is no longer a distant concern but a present market risk. While immediate budget cuts remain politically difficult, markets are beginning to price in the reality of slower growth, rising debt service costs, and potential tax increases—especially for high earners. Among other solutions, a millionaire’s tax is being discussed. As seen below, Net Interest expenses are now only below Medicare and Social Security for Government spending so far in 2025. We are on pace for 5 consecutive years of increasing Net Interest expenses compared to the previous year.
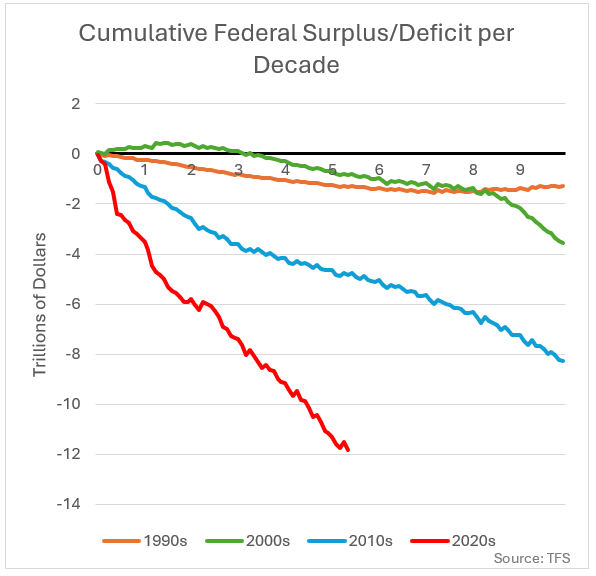
The bottom right chart highlights how out of control the deficit has become. We are only halfway through the 2020s and have run up an $11.8 Trillion deficit – dwarfing deficits in past decades. Against this backdrop, Municipal bonds offer a compelling solution: stable income, strong credit fundamentals, and federally tax-exempt yields that look increasingly attractive.
Moreover, Municipal balance sheets remain in strong shape. Years of conservative budgeting, pandemic-era federal aid, and resilient tax revenues have left many issuers with healthy reserves and positive outlooks from rating agencies. In a time when the federal government is under pressure and fiscal prudence is a rare and valuable commodity, many states and localities are still operating with discipline.
After-Tax Advantage: Municipals vs. Treasuries
We are in a rare environment where even pre-tax yields are higher for Munis than Treasuries. Currently, you can buy a pre-tax 10-Year Treasury for 4.25% (2.68% after-tax) or a pre-tax Muni for 4.50%. This dynamic creates a compelling opportunity to allocate more fixed-income exposure to Municipals without sacrificing credit quality or liquidity.
As for interest rate risk, despite their longer maturity, 20-year municipals purchased at a premium that are callable in 10 years generally carry lower duration than 10-year Treasuries. This gives investors the combination of greater after-tax income and reduced interest rate risk exposure.
Municipal bonds have become increasingly appealing relative to Treasuries for investors in tax brackets 20% or higher. Assuming initial investments of $10 million in each, the graph below illustrates the cumulative after-tax income from a Municipal bond portfolio compared to a portfolio of Treasuries. Over just a 10-year span, the Municipal bond portfolio generates $2.5 million more income than the Treasury portfolio, highlighting the after-tax income advantage Munis can deliver. For investors seeking stable, tax-efficient income in the current rate environment, Municipals remain a valuable cornerstone of a fixed-income strategy.

Security Selection Matters: Credit Divergence in Healthcare & Higher Ed Munis
In today’s municipal market, the gap between strong and weak credits—particularly in the healthcare and higher education sectors—is widening at an accelerated pace. While these sectors have long been staples in tax-exempt investing, structural headwinds and post-pandemic shifts have exposed fundamental differences in financial health, governance, and adaptability across issuers. For investors, this means credit selection is no longer just a best practice—it’s essential.
Healthcare: A Tale of Two Systems
The not-for-profit hospital space is under mounting pressure. Rising labor costs, shifting reimbursement structures, and declining inpatient volumes are weighing on margins. Smaller regional hospitals and stand-alone systems are more vulnerable, lacking the scale and flexibility to navigate these headwinds effectively.
In contrast, large multi-state health systems with diversified revenue streams and strategic partnerships have demonstrated resilience. Many of these credits have maintained strength, showing stable or even improving outlooks due to cost containment, service line optimization, and thoughtful capital planning. Investors must look beyond ratings alone. Operating margins, days cash on hand, the size of the service area, and payer mix are critical metrics. Strong systems are expanding access points and investing in outpatient infrastructure, while weaker peers are closing facilities or relying on federal support that may not continue.
Higher Ed: Enrollment Is No Longer a Given
In higher education, demographic shifts are driving a sustained enrollment decline, particularly among small, tuition-dependent private colleges. These institutions often lack endowment support or diversified income sources, making them vulnerable to both cost inflation and competitive pricing pressure. Moody’s and S&P have issued repeated warnings on the long-term viability of many of these schools.
By contrast, flagship public universities, well-endowed private institutions, and those with strong research funding or graduate/professional programs are holding their ground—or gaining market share. These schools typically boast healthy balance sheets, steady application demand, and brand equity that attracts both students and donors. Key indicators to watch include net tuition revenue trends, student selectivity, and retention rates. In a sector where headline risk is growing, disciplined credit analysis is necessary.
Bottom Line: Credit Research Is Key
Both sectors underscore a broader theme in the 2025 Muni landscape: The era of “buy the index” should be over. Passive index exposure may include structurally challenged credits that fail to compensate investors for growing risks. These funds and ETFs have a heavy concentration of debt from the biggest borrowers, not necessarily debt from the highest quality borrowers. In contrast, active selection focused on financially sound issuers with clear strategic vision can deliver durable tax-exempt income—without credit surprises.
Conclusion
We continue to be concerned about fiscal policies and wonder if our leaders have what it takes to tackle our growing national debt. But while we find ourselves in a world defined by policy uncertainty, rising deficits, and geopolitical tension, municipal bonds offer clarity: stable income, favorable tax treatment, and strong credit fundamentals. With high after-tax yields and steady issuer strength, Munis present an attractive opportunity for investors seeking quality and income.