2023 has seen positive returns across all segments of the muni market. The overall economy stabilized after the collapses and buy-outs of multiple banks including SVB and First Republic. Consumer spending remained strong, and sentiment improved regarding inflation moving forward. While rates have risen, the pace of increases has slowed. Hopeful that they are winning the battle against inflation, we may be entering a new season of higher yields with a data-dependent Federal Reserve.
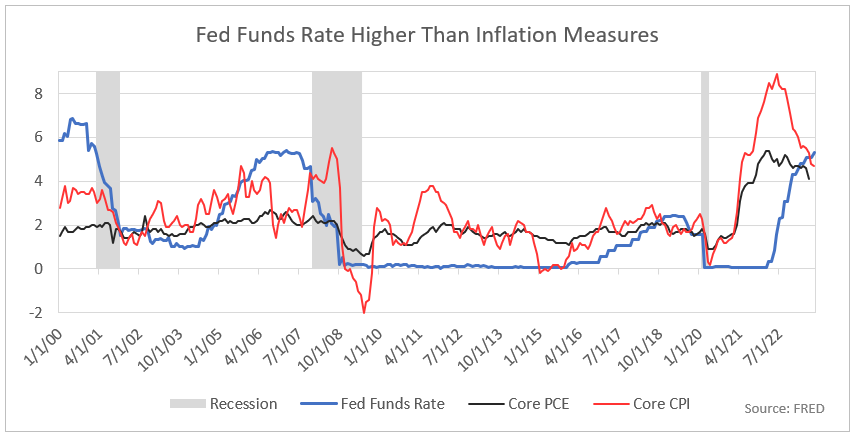
Fed Funds Rate Above Inflation Gauges
This past quarter marked the first time since 2019 that the upper bound Federal Funds Rate (5.50%), below in blue is above both Core CPI (4.7%) and Core PCE (4.1%). Charles Evans, former President of the Chicago Fed, has mentioned this was one of the FOMC’s goals and would mark a significant moment in our fight against inflation. We have become increasingly restrictive in policy as the Fed has raised rates 525 basis points since March 2022. Finding the terminal rate has proven difficult. Do we have further to go, or have we already gone too far?
Fed Funds Rate More Restrictive
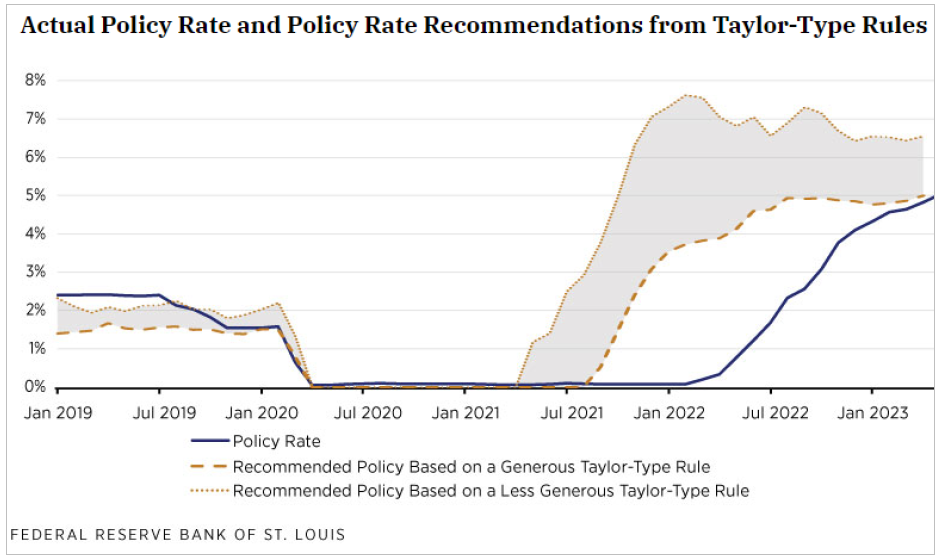
Our firm uses Top-Down analysis of the Macro Economy to formulate our “base case” for our investment strategy. We continue to monitor Monetary policy to determine how high short term interest rates might need to increase for the Fed to achieve their longer-term policy goals of 2.0% inflation. Jim Bullard, the former head of the St. Louis Fed, has created a modified Taylor Rule model to determine policy rate recommendations. In a presentation to Stanford in May 2023, he stated his model calls for a Fed Funds rate of 5.0%-6.50%. The shaded area of the chart below shows the desired range for Fed policy. The last move by the Fed to increase the Funds rate to 5.50% has put the rate into the model’s desired range. This rate should be restrictive enough to bring down inflation. Therefore, our “base case” is for interest rates to trend lower over the medium term.
Credit Conditions Have Tightened and May Lead to a Recession
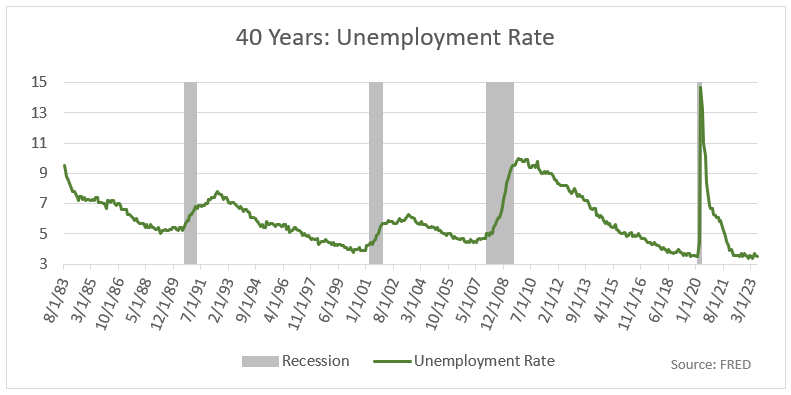
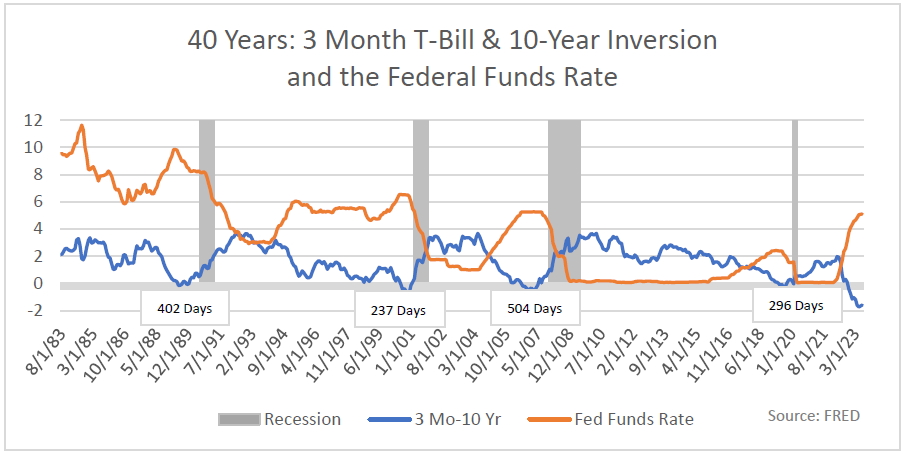
The next 2 charts look back over the past 40 years at the unemployment rate (green), the Federal Funds rate (orange), and the 3-Month T-Bill & 10 Year Treasury inversion (blue), with recessions shaded in gray. The first chart below illustrates the fact that the unemployment rate does not meaningfully begin to rise until a recession has already begun. Thus, it is a lagging indicator. We have not been at these levels of unemployment since 1969. Seeing that full employment is half of the Fed’s dual mandate, this continues to give them the green light to keep rates higher for longer.
Raising the Federal Funds rate tightens credit, leading to weakness and potentially a recession. The way our financial system works is through banks borrowing short and lending long. When short rates are higher than long rates it is unprofitable for banks to lend money, so credit becomes very restrictive. The chart below highlights that raising the short-term rates leads to an inversion in the 3 Month T-Bill & 10-Year Treasury. This inversion preceded a recession on average of 381 days in 1990, 2001, and 2007. As of this print, we are at 296 days since the start of the current inversion. This is also the deepest inversion we have ever had at 189 basis points.
How Has the Economy Avoided Recession?
Why haven’t we already gone into a recession? Fiscal policy in response to the pandemic in 2020 was unprecedented. The chart below from the same Bullard presentation mentioned above shows Fiscal policy resulted in excess savings of $2.1 trillion. Consumers have been spending these excess savings. In March 2023 the $2.1 trillion of excess was down to about $500 billion. Hamza Abdelrahman and Luiz Oliveira of the San Francisco Fed recently estimated households held less than $200 billion of excess savings by June and they believe these savings will be depleted in Q3 2023. There is a lag between what happens in the financial markets before it affects what happens on Main Street. The restrictive funding environment should begin to have a more negative effect on the consumer. This is already being seen with rising delinquency rates for auto loans, credit cards, and a slowdown in the real estate markets.

Municipal Bond Upgrades/Downgrades
As portfolio managers, one of our jobs is sector selection. We believe certain sectors have more underlying strength than other sectors, and there are certain credits that we avoid. We like bonds with good public purpose and want to select credits with greater potential for upgrades vs downgrades. While this may seem intuitive, this research and execution takes work. Since Covid and subsequent rising inflation, one sector we are increasingly selective in is hospitals. We are currently avoiding hospitals with limited populations. Rising wages have been a headwind for the health sector and the FHN chart below shows 73 upgrades vs 167 downgrades. This is not a favorable ratio of .44. We have also been avoiding small liberal arts colleges and universities with high tuition costs. On the other hand, one area of focus over the past few years is in Municipal Utility Districts, or MUDs. A MUD deal employs property tax revenues from specific neighborhood districts to repay the debt. We are selective in which MUDs we invest in for clients. With an upgrade/downgrade ratio of 29, we are thankful we have increased exposure in this sector.
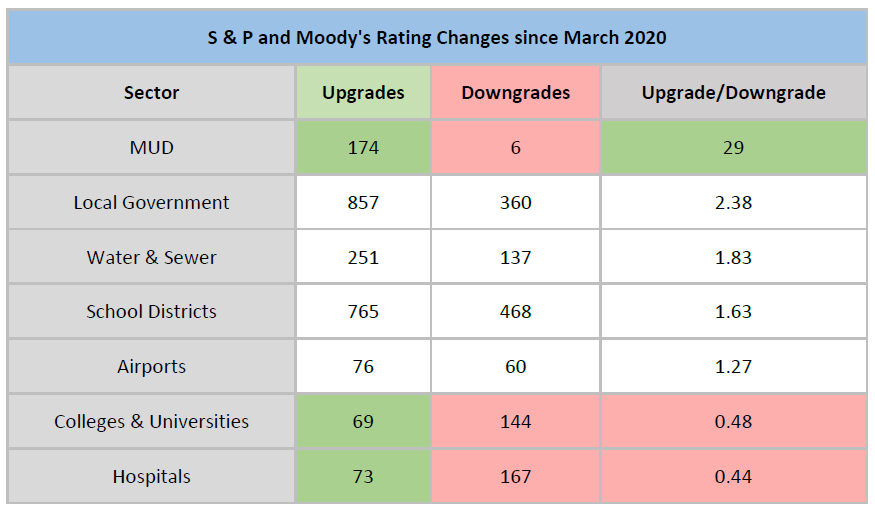
Source: FHN Financial
Bond Yields at Attractive Levels

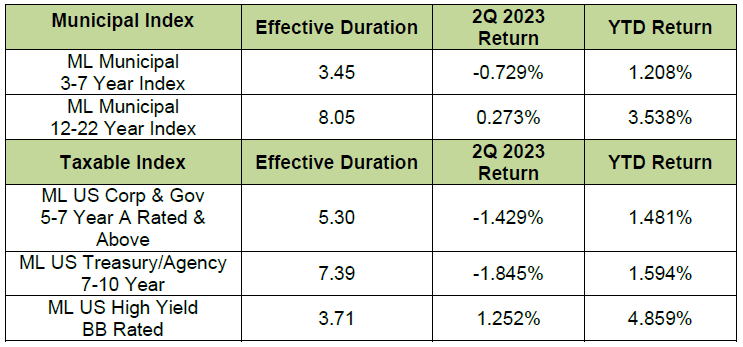
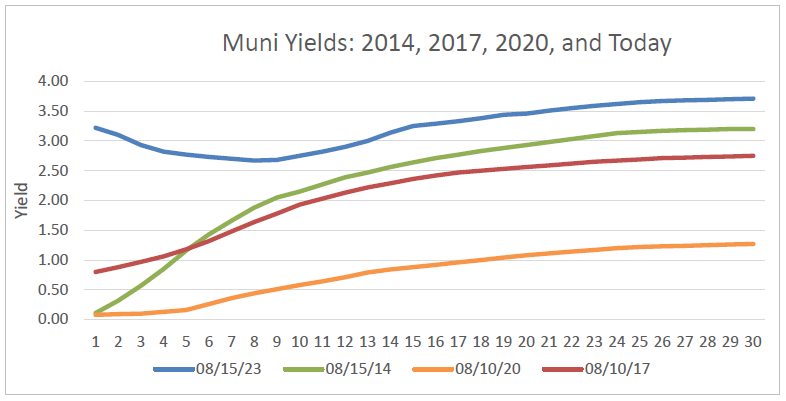
On March 9, 2020, the 10-Year Treasury closed at 0.54% for the lowest close of all time. Over the past 50 years, the 10-Year has averaged 5.93%. Over the past 20 years it has averaged 2.90%. As of this writing, we sit at 4.25%. As you can see on the chart above, we have not hovered over 4% since August of 2008 -15 years. As a nation, we went from ‘TINA’ (‘There Is No Alternative’ to stocks) to many people buying Treasuries in 6-8 months. Yields have been attractive for Treasuries and Munis for an extended period now and we remain in a buy zone.
The last time longer Muni yields were close to this level was 2014. As you can see below, the Muni curve is still inverted and has been since December 9th, 2022. It is the first time in history the Muni curve has inverted at these levels. This provides investors with opportunities. We have always looked at the yield curve to identify opportunities for our clients. Right now, it is logical to avoid the ‘belly’ of this inverted curve and build more of a ‘barbell’ portfolio. We invest a certain percentage of the portfolio short in case yields continue to rise, then invest a certain percentage of the portfolio longer to lock up higher yields and protect the client’s income stream.
Conclusion:
Lower Rates and Economic Weakness Ahead
The Federal Reserve has had great success in bringing inflation down from the highs of 2022 to the current levels. There are positives in the economy - unemployment remains extremely low, the consumer has remained strong, and inflation is easing. The soft-landing narrative is loud now, but it is difficult for us to be overly sanguine. Fitch has downgraded the US and they are talking about downgrades for larger banks. Fiscal debt levels continue to rise, and the average consumer is taking on record debt as well. Excess savings are potentially under $200 billion and could be depleted while college debt payments resume this fall. With rates remaining high, we could see default rates begin to rise. This is all true while inflation is not yet at the Fed’s target of 2%.
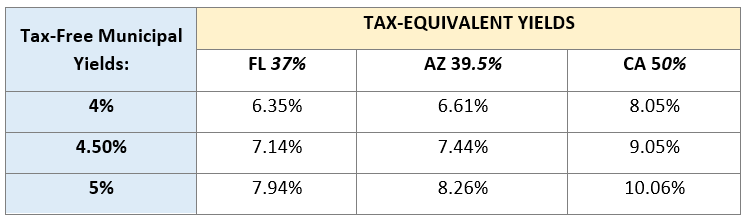
The Fed will continue to keep rates restrictive as they remain ‘resolute’ to their 2% goal. They waited too long to raise rates and we are concerned they will wait too long to lower rates as they remain data dependent. Tax-equivalent yields (above) are extremely attractive for the amount of risk taken in our conservative portfolios.