The 4th quarter was the lone quarter of 2022 with positive yields in the municipal market. However, a good Q4 could not make up for what was one of the worst years ever for bonds. Rising inflation led to eight Federal Reserve rate hikes in the Fed Funds Rate over the past 12 months. This led to major declines in all the indices in 2022 as seen below.

Consumer Sentiment - Revisited
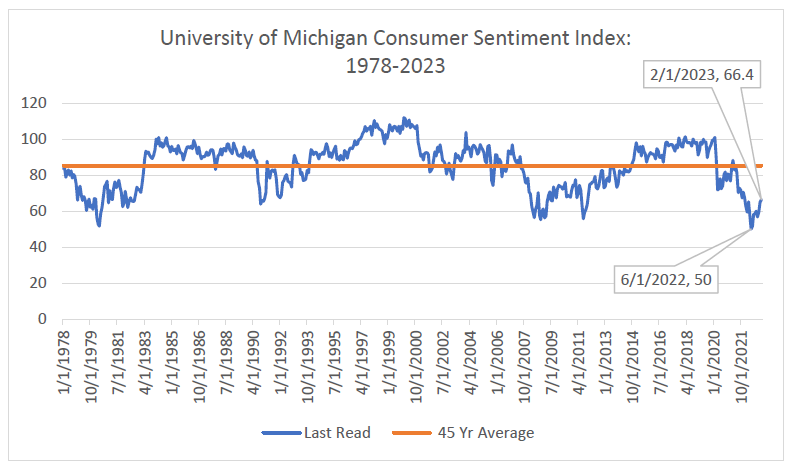
Last June, the University of Michigan Consumer Sentiment index hit an all-time low of 50 which led to the Federal Reserve increasing the speed and amount of their rate increases. While still below the historical average of consumer attitudes and expectations as seen below, the Fed seems to be getting consumer confidence back as we look through inflation to the future.
While we believe peak inflation is in, we also believe we have a long road ahead of us. The latest CPI and PPI reports were hotter than expected and the Nonfarm Payrolls MoM was almost 3 times stronger than expected. The robust fiscal and monetary response to the pandemic has kept the consumer and economy strong, but we will highlight multiple things in this newsletter that point to a potential slowdown ahead.
Source: Bloomberg
Multiple Yield Curve Inversions

Source: Bloomberg
The chart above shows the spread for 2 different series of yield curve spreads. The orange line shows the spread between the 10-year UST and the 3-month T-Bill. For example, if the 3-month bill yields 4.83% and the 10-year yield is 3.81% the curve would have a negative inversion of 102 bp’s. The blue line shows the spread between the 10-year UST and the 2-year UST. When these lines are below zero, we can say the yield curve is inverted. These series are both showing extreme readings below zero and are the most inverted during our 40-year period on the chart. The Fed is discussing further rate hikes in the short end which could possibly cause the inversion to become even more pronounced.
Muni Yield Curve Inversion
Source: Bloomberg
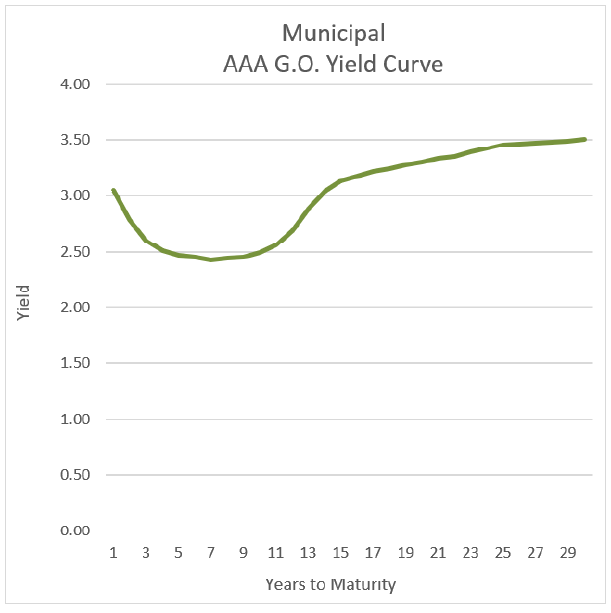
The chart above shows the Muni curve for a AAA-rated General Obligation bond as of mid-February 2023. The yield curve for Munis is normally upward sloping. It is highly unusual for the AAA curve to be inverted but it is currently the most inverted we have seen in the past 50 years. The yield curve for a high-grade bond due in 1 year is about 3.00% and the yield for a similar bond due in 6 years is 2.37%. This is an incredible inversion of 63 bp’s. We believe this is a highly significant event and is not sustainable over time.
This inversion has made bonds in the belly of the curve quite unattractive. We have been pushing out further on the curve to take advantage of the higher yields that are available. We also have seen credit spreads widen for A-rated Munis and investment grade securities which are enhanced by insurance. These bonds are trading at levels of plus 100-125 bp’s to the AAA curve. We are finding good value in the 13–20-year part of the curve.
US Personal Consumption Expenditure Core Price Index YoY

Source: FRED
These policies have helped the Fed make gradual progress toward the 2.0% target it has set. The chart above shows the Fed’s preferred measure of inflation and its decline from almost 5.5% annually to a little under 4.5% during the last year. We believe the Fed will continue to make progress toward the 2.0% target, however their policies are so restrictive the odds of a recession are steadily increasing. This has become our base case scenario.
Credit Conditions
Source: Bloomberg
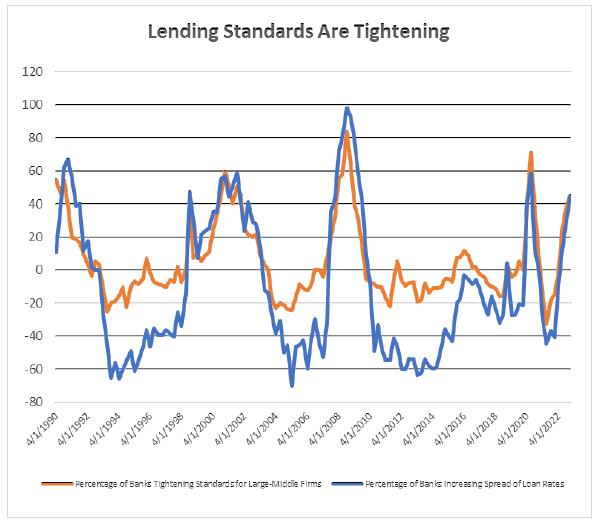
The Fed conducts surveys of Senior Loan Officers at large and medium banks to measure current banking practices. The chart above shows the results of these surveys since 1990. The blue line shows the cost of loans has been rising, and the orange line shows the banks have been increasing their lending standards which makes it more difficult to obtain loans. These tighter credit conditions are a significant headwind for economic growth.
Federal Reserve Balance Sheet
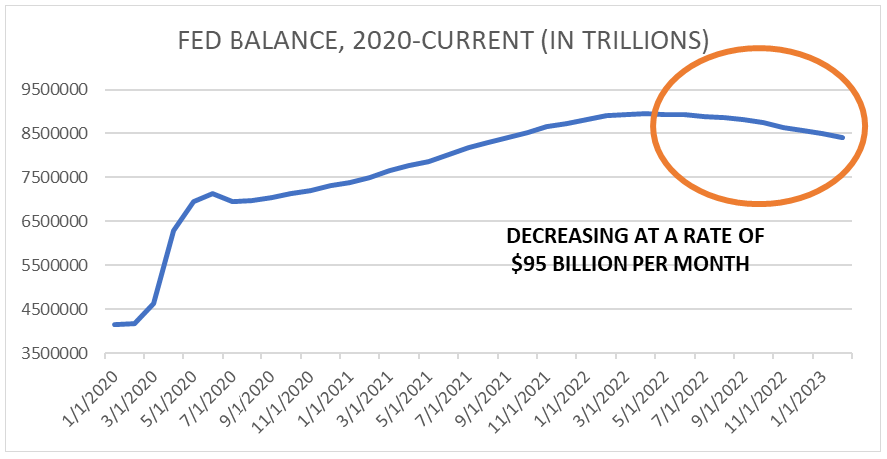
During the pandemic, the Fed increased liquidity dramatically by purchasing about $5 trillion of UST and Mortgage-backed securities. They continued to engage in Quantitative Easing (QE) for about 2 years. The Fed has changed this to a policy of draining liquidity from the banking system and is reducing its Balance Sheet or engaging in Quantitative Tightening (QT) as shown in the chart below. The balance sheet is now at $8.38 trillion – down from the high of $8.97 trillion. This is making conditions more restrictive in the banking system which should lead to slower or negative economic growth in the future.
Source: FRED
Fed Policy and Money Supply
Fed chair Powell recently said the disinflation process has begun. While we agree with his statement, it is important for investors to realize this process has begun – it is not over. It will probably take a year or more before inflation is consistent with the Fed’s target. Investors hoping for a quick return to 2.0% inflation and a rapid lowering of short-term rates beginning in mid-year are likely to be disappointed.
However, this is good news for fixed income investors. It allows them enough time to add to their bond positions and build up income streams that are protected from reinvestment risk. Investors are also able to lock up attractive yields with confidence the Fed will be successful in their efforts to bring inflation under control. We believe the Fed’s monetary policies will be successful because they are quite restrictive and will slow down the economy.
The chart below shows the year over year change in the money supply. During the pandemic, the Fed expanded the money supply dramatically by as much as over 25% annually and continued to let it grow rapidly for over a year. Now monetary growth has been declining with M2 being negative for the last period. This will help reduce the level of inflation.
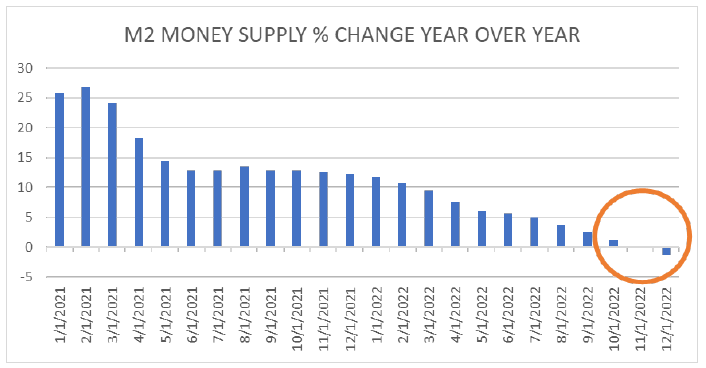
Source: Bloomberg
Breakeven Rate: Bonds Are Attractive
The bond market believes the Fed will be successful in reducing the inflation rate. The chart below shows the breakeven rate for inflation over the next 10 years is 2.31%. This rate is determined by subtracting the 10-year TIPS rate from the yield on the 10-year UST. For example, if the yield on the 10-year UST is 3.81% and the yield on a 10-year TIP is 1.51% the breakeven inflation rate would be 2.30%.
The blue line in the chart shows the yield of the 10-year UST at 3.81%. Over long periods of time the yield on the 10 year tends to track the breakeven yield. We would expect the yield to be about 1.0% higher than the breakeven yield. Since it is 2.0% higher, we can conclude bonds are currently attractively priced.
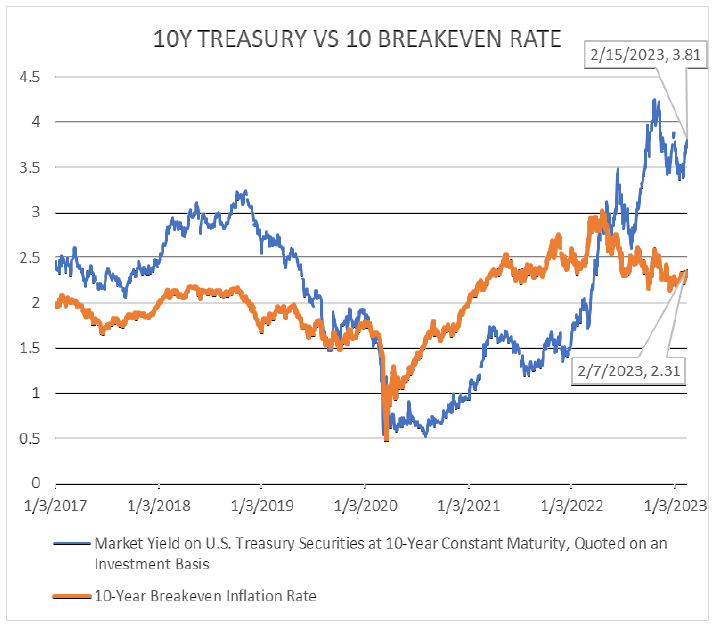
Source: Bloomberg
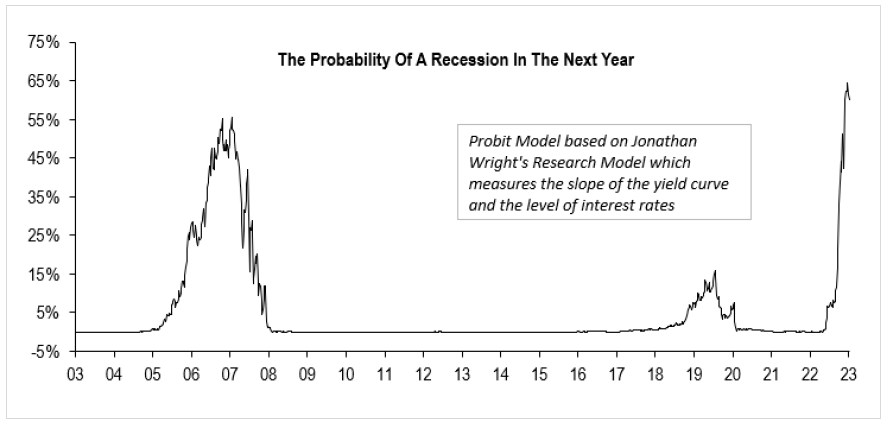
Recession Probability Model
During the last 20 years we have used a Probit Model based on Jonathan Wright’s research to predict the likelihood of a recession in the next year due to a yield curve inversion (see below). Our model is currently giving a strong signal that a recession will be coming soon. Our research shows there is about a 1-1.5-year lag from the peak of the chart until the recession occurs. During the pandemic there was a serious over-reaction by policy makers for both fiscal and monetary policy. The amount of liquidity put into the economy was unprecedented. Although the amount of credit tightening is severe it may take longer than normal for the economy to enter a recession.
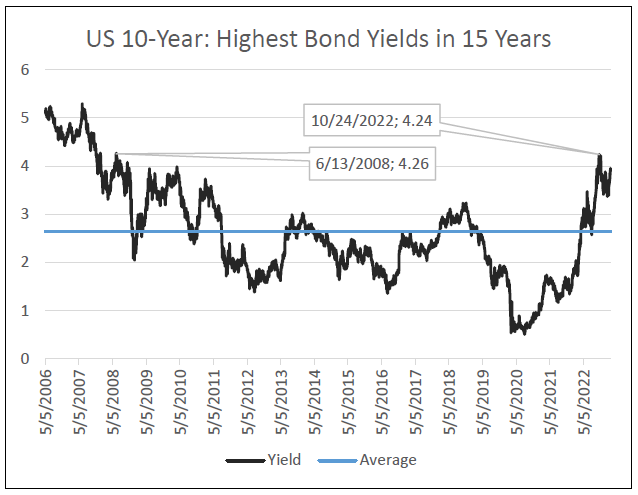
Conclusion: A Great Time to Lock in Longer Yields
Source: Bloomberg
The chart above shows the US 10-Year Treasury since 2006. The 10-Year was below 1% for 10 months during the pandemic. With rising inflation and rising yields after 8 rates hikes in 12 months, yields have skyrocketed. All markets have shifted, and the bond market has had a reset.
In late October of 2022, the 10-Year closed at 4.24%. The last time the 10-Year closed at that level was on 6/13/2008 - or about 15 years ago. As stated above, yield curve inversions, sticky inflation, tightening lending standards, a continued hawkish Fed, and many more signals point to a future economic slowdown and lower rates in the future. In 2007-08, bond investors would have been wise to extend their duration and buy longer bonds in anticipation of falling yields in the coming decade. We believe we are in a similar situation right now.
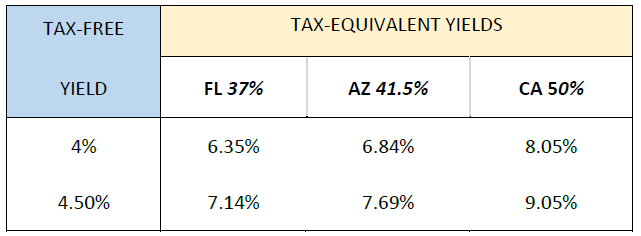
We are currently seeing attractive yields in the Muni market when extending 13-20+ years. Locking up Tax-Free yields over 4% has not been possible for a very long time. We are currently in a window where we can attain higher yields near or over 4% and protect income streams for long periods of time.