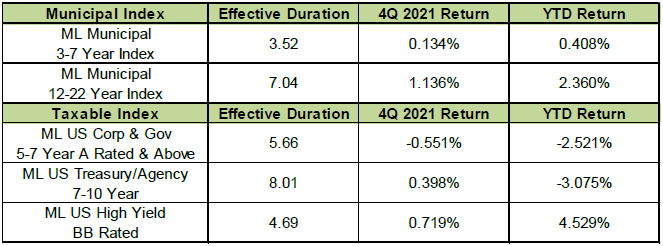
Municipal bonds and high yield outperformed treasuries and investment grade credit in 2021 as high inflation and the prospect for quantitative tightening began to weigh on fixed income markets.
The table below summarizes the returns of a few major fixed income indices.
From Quantitative Easing (QE) to Quantitative Tightening (QT)
Now that inflation has been running hot for a year, the Fed is talking about increasing the Fed Funds rate and reducing it’s Balance Sheet in an effort to get inflation under control. The chart below shows the monthly increases in CPI since January of last year. Since the Fed’s target rate for inflation is about 2.0%, we should hope to see monthly increases a little under .2%. None of these increases have been consistent with their mandate to provide price stability in the economy. During this time the Fed continued to engage in QE to the tune of $120 billion a month. This policy error has put the Fed in a very difficult position.

The Fed’s Balance Sheet
When the pandemic hit hard in March 2020, the markets collapsed and the Fed stepped in to provide an emergency response. By the end of April they had purchased about $1.75 trillion worth of UST and mortgage-backed securities. Beginning in June 2020, the Fed was adding $120 billion a month of QE. By the end of 2020 it was becoming clear that inflation was a problem. The Fed continued to engage in QE with an untested emergency response tool for several more months until deciding to “taper” their purchases for QE in November 2021. These actions have put them way behind the curve in providing price stability. The Fed is now talking about raising the Fed Funds rate and engaging in QT simultaneously. We believe it is a mistake to use both of these tools at once to battle inflation at this time. The US economy is extremely leveraged and cannot handle a rapid increase in interest rates. We also believe it will be difficult for the Fed to reduce the size of it’s balance sheet in an orderly way.
The charts below show the distribution of maturities in the Fed’s balance sheet portfolio. Today the Fed’s balance sheet is about $9.0 trillion.The average maturity of the portfolio is 11.73 years. However, 48% of the portfolio is due within 5 years. About $1.1 trillion runs off in a year. This means it is theoretically possible for the Fed to reduce the size of their balance sheet significantly and dramatically in the next few years if that was their desire. We think this is extremely unlikely because it would be difficult for the markets to handle this much supply in an orderly way. During the period from 2/2020 to 2/2022 the amount of new debt to finance the deficit the Treasury issued increased by $4.107 trillion. The Fed bought over 80% or $3.305 trillion of UST debt. The Treasury has become very dependent on the Fed to help them with their financing. It seems like the Fed is in a very difficult position.
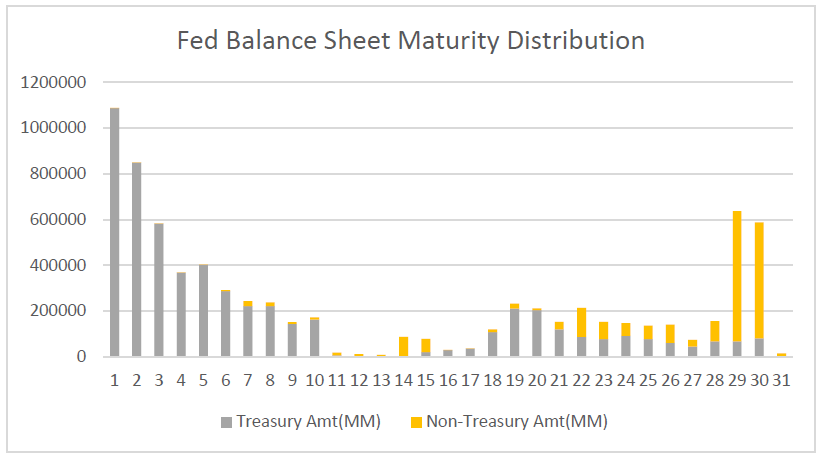
Source: Bloomberg
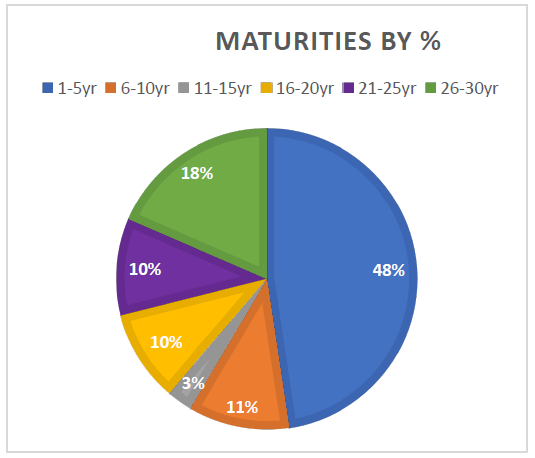
Source: Bloomberg
Impact Bonds
ICE recently issued a report about Impact Bonds – also known as ESG bonds. They split these bonds into 3 categories:
Green Bonds - The proceeds are used to fund improvements which generate environmental benefits.
Social Bonds - The proceeds are used to help mitigate a particular social issue.
Sustainable Bonds - The proceeds are used to help finance a combination of both green and social projects.
The State of California has been a leader in this area followed by New York and Washington. The largest category of impact bonds was for multi-family housing. The next largest category was for local single family housing which was followed by bonds issued to fund mass transit projects.
The U.S. Energy Department is planning to invest heavily in cleaner energy solutions. Last year they approved auctioning off offshore leases for wind turbines. They are also funding investment in more electric vehicle charging stations. Last year there was a significant increase in these types of bonds issued in the Muni bond market. There was an 83% increase in the amount of impact bonds issued in 2021 compared to 2020, and over the last 5 years impact bonds have increased by over 270%. We expect this trend to continue.
Fixed Income Investing In a Rising Rate Environment
There are several ways to help mitigate interest rate risk of a fixed income portfolio in a rising rate environment. Perhaps the most obvious way is to go to cash but with short-term interest rates at/or near zero this is not a great option. However, short term rates have been rising and we are able to get yields of about 1.50% for maturities due within a year. This is a significant improvement over where rates were last year. We have been investing in more in this part of the yield curve.
A primary advantage of an intermediate-term fixed income strategy is it is already a conservative strategy. A typical portfolio in this strategy has a duration of 4.5-5.5. Duration is a measure of how much interest rate risk is in a portfolio. We have allowed our portfolios to shorten by not actively reinvesting in longer securities. During the course of a year this reduces the duration from a target of 4.5-5.5 to 3.5-4.5. This is a significant change in the riskiness of the portfolio to changes in interest rates.
We have been investing in bonds which have shorter calls (2-4 years) and longer maturities of up to 15 years. The bonds we are purchasing are likely to be called on the call date, but provide more income than cash. If these bonds do go to maturity which is unlikely, we will pick up a significant amount of yield. We have increased our allocation to bonds with these characteristics since they have cheapened significantly.
We have bought some floating rate securities but these bonds are difficult to find. Most of them were issued in 2007 and are only available in the secondary market. These bonds have coupons which usually change quarterly and the coupon is pegged at a certain spread to a short-term index such as Libor. These bonds will perform well in an inflationary market. We continuously watch for these on the secondary market.
We have purchased some higher yielding low investment grade Corporate bonds for companies which will benefit from an improving economy or investment in infrastructure. Most of these are epicenter companies which were affected by COVID. Airlines are an example of this. Security selection is very important in this strategy. We like shorter maturities and the less leveraged companies in an industry. This strategy has allowed us to enhance returns by picking up extra yield while simultaneously protecting the principal in our portfolios. We still like these types of bonds and yields have risen on them as well.
Municipal Returns vs Rate Hikes
The table below shows the Bloomberg Municipal Bond Index vs. the federal funds rate over the last four rate-hike cycles. Over the long term municipals have performed well regardless of the direction of interest rates. Periods of volatility and higher rates can provide windows of opportunity to add more yield to the portfolio and bolster long term return potential. We believe a move away from ultra-low interest rates will ultimately be a good thing for municipal bonds investors and their portfolios.
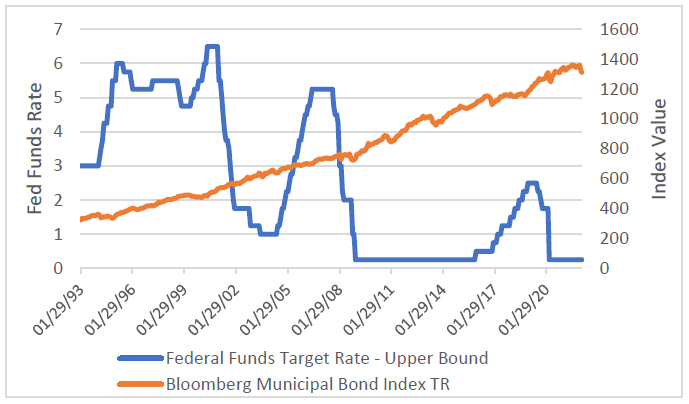
Source: Bloomberg
Conclusion
Fiscal and Monetary policy is becoming less aggressive and will soon become more restrictive. This should lead to a slowdown in economic growth and higher interest rates. Poor monetary policy decisions have left the Fed in a tough position. They have caused inflation to increase to levels which are clearly unacceptable. They are now talking about raising the Fed Funds rate and doing Quantitative Tightening simultaneously.