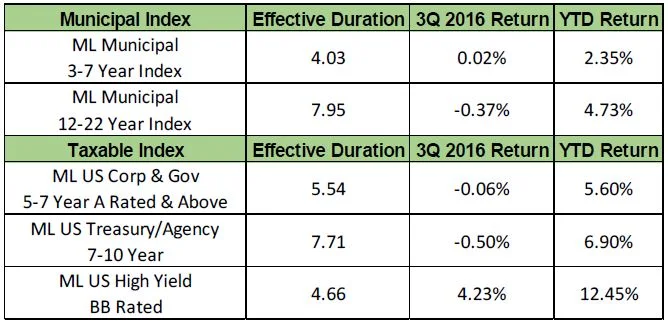
Longer dated municipals, investment grade corporates, and U.S. government securities declined in the third quarter but remained positive for the year. Intermediate municipals were flat while high yield holdings continued to strengthen.
Fixed Income Return Summary
The table below shows the quarter and YTD returns for a broad range of fixed income indexes.
Opportunity in Short Municipals
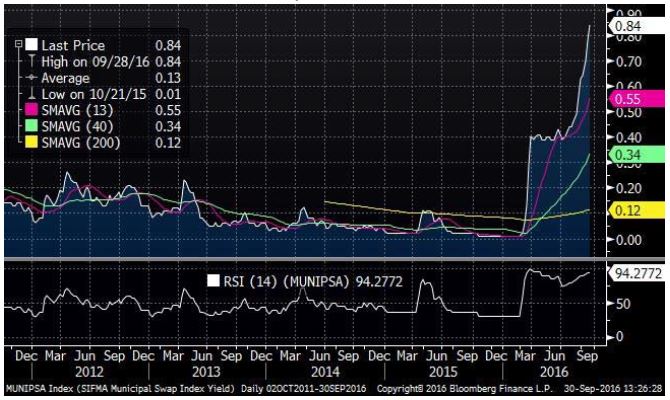
There has been over $100 billion withdrawn from tax‐free money market funds since the first of the year in anticipation of SEC rule changes. This has put pressure on tax‐free money market instruments as these funds have liquidated assets to meet redemptions. This has caused the rate on Variable Rate Demand Notes (VRDN’s) to increase to levels not seen for the last 5 years. These levels are now around 0.84% (84 bp’s.) This has caused rates in the 1 year part of the curve to increase to 75 bp’s to 90 bp’s. We believe this represents a great opportunity for investors who have been sitting in cash to increase yields and still be defensive. The chart below shows VRDN yields for the last 5 years. VRDN’s trade in $100,000 denominations.
New Issue Supply ‐ The Technicals
Even though $100 billion has left Tax‐Free money market funds, about $50 billion has been invested into Muni bond mutual funds this year. This has created strong demand for Muni bonds. The Muni market is on pace to have a record amount of issuance this year. The total for 2016 may reach $435‐$450 billion. However, a large portion of new issues is for the purpose of refunding existing bond issues. The low absolute level of interest rates has enabled issuers to call in higher interest cost debt and replace it with new lower cost debt. This does not increase the amount of bonds held by investors. It is similar to a mortgage refinancing. This means that the increase in supply this year is not as burdensome as it appears since the amount of new money financings has been relatively light.
Infrastructure Needs
The U.S. has massive infrastructure needs which was pointed out by America’s Society of Civil Engineers in a 2013 study. These needs, represented by letter grades A through F, are shown in the table below.

The study estimated the investment needed to bring our infrastructure up to par was $3.6 trillion by 2020. Current spending on infrastructure needs is roughly $400 billion with about 75% of that being met by State and Local governments. In fact, the amount of funds spent by the Federal government has actually declined during the last 6 years. Since the financial crisis municipalities have struggled to get their budgets back in balance.
They have done this largely at the expense of delaying infrastructure projects. In the meantime the needs keep increasing. After the financial crisis in 2008 the government came up with a program to issue Build America bonds. These bonds were taxable municipal securities with a 35% interest subsidy for the issuing municipality from the federal government. The program was designed to encourage municipalities to invest in infrastructure as a way to boost our economy. The program was very successful. Unfortunately, the federal government ended the program in late 2010 and since then has reneged on their promise to subsidize the interest costs for the issuers at 35%. Instead, due to sequestration and a lack of will to balance the budget, this amount has fallen to approximately 25%. This may make it difficult to get Muni issuers to trust the government in the future with a similar program. Our infrastructure needs are continuing to increase as our facilities get older. The economic costs of delaying these projects is rising, and so are safety concerns. We believe politicians are going to have to find a way to come together to meet these needs.
Muni Default Rates
The table below shows the cumulative default rates for Moody’s rated municipal and corporate bonds after 10 years for the period 1970‐2015.

This study shows the cumulative default rate for investment grade municipal bonds was only 0.09% over a 10‐year time period during the last 45 years. Aaa rated Muni bonds had a default rate of 0.00% while A rated bonds had a default rate of only 0.06%. Since the default rates are so low for investment grade bonds, we feel the risk/reward is very compelling for investment grade portfolios. We also prefer taxable municipal securities compared to Corporate bonds. The default rates for these bonds are significantly lower than for equally rated Corporates and the yields are typically higher.
Conclusion
During the last year ending 6/30/2016 the U.S. economy had year over year real growth of only 1.3%. This is well below the long term trend of 3.0%. The Fed has reduced interest rates to zero and has kept them there for about 8 years. While this policy has reduced unemployment it has not been successful at getting economic growth back to trend. Larry Summers recently made the argument that a significant investment in infrastructure would create good jobs and provide economic stimulus to a stagnant economy. Investment in infrastructure would expand the tax base and increase economic growth. It may possibly pay for itself over time. This is a much more attractive way to energize our economy than to keep pumping money in an effort to get it going. We have massive infrastructure needs in our country that need to be addressed and an economy that is anemic.