Tax‐free municipals performed well in 2015 followed by investment grade corporates and treasury/agency paper. High yield debt ended the year in negative territory after further declines in the fourth quarter.
Fixed Income Return Summary
The Fed Seeks to Normalize Rates
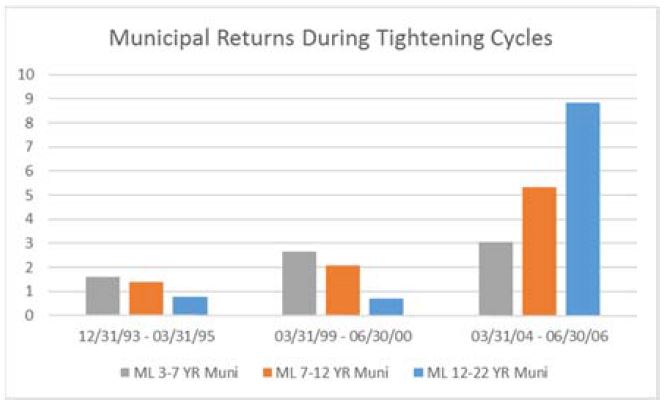
The Fed has been criticized for keeping the Fed Funds rate at 0.0%‐0.25% since the financial crisis in 2008. On December 16, 2015 they finally took the first step to normalize interest rates by increasing the overnight rate to 0.25%‐0.50%. They have also stated there will likely be further measured rate increases this year, depending on how well the economy performs. Since the increase the bond market has had a muted response with rates on the 10 year UST down about 7.5 bp’s in yield. We do not believe the data currently supports a tightening by the Fed. GDP is growing below trend and inflation is below their desired level. The chart below shows the performance of different Muni Indices during the last 3 Fed tightening cycles.
Total returns were positive for each index during the tightening period. We believe our current strategies should do well against the backdrop of a weak economy.
Growth in Real GDP: Consistently Below Estimates
The chart below shows the underperformance of the U.S. economy since the financial crisis in 2008. Barry Bosworth posted this chart on Brookings last month. The top line shows the estimate of GDP by the Congressional Budget Office (CBO) in 2007. The CBO later revised their estimates in 2014 which still overestimated the strength of the economy. The bottom line shows actual GDP growth which is way below expectations. The Federal Reserve has had the same problem of expecting too much from our economy. This has been demonstrated regularly by the “dot studies” in the FOMC reports. We believe economists are underestimating the impact of high debt levels and negative demographic trends on economic growth. After all, debt brings future economic activity into the current time frame. Current Fed policies rely on getting growth now at the expense of future economic activity. This creates a considerable headwind for future economic activity.
Labor Demographics: No Sign of Inflation
Bosworth also argues we have supply side difficulties. One example is the difficulty of reconciling the current low level of unemployment with the falling Labor Force Participation Rate. Many have argued discouraged workers will return to work as the job market improves. Unfortunately, there has been little evidence in support of this argument. Bosworth states the participation rate of women aged 25‐34 has fallen dramatically, and the rise of participation rates by males 55 and over has stopped growing.
Supply side concerns are also showing in productivity rates. The chart below shows the decline in recent rates of productivity for workers.
The annual trend of increase has slowed from 2.9% in the 1995‐2005 time period to annual increases of only 1.3%. This lack of productivity growth for workers is a primary reason for the anemic wage growth we have seen as the unemployment rate has declined.
Mark Perry from the American Enterprise Institute posted this chart last month which shows the decline in Real Median Household Income.
The chart shows the demographic changes in retired and disabled workers as a Percent of the U.S. population increased from 18.3% in 2004 to 21.3% in 2014. During this period the number of retired workers increased 27% and the number of disabled workers in our economy increased 37.5%. This helps to explain why households without a wage earner rose from less than 20% in 1999 to 24% in 2014 and Real Median Household Income has declined during the last 15 years.
Tax Rates Are Going Higher
Maximum Federal Tax rates in the United States have varied widely over the last century, from as low as 7% in 1915 to as high as 94% in 1945. After peaking in 1945, tax rates have trended lower against a backdrop of ballooning national debt. The following chart shows the maximum federal tax rate vs. public debt.
Maximum tax rates are now well below the 100‐year average of 59.6%, even as debt levels have climbed above 18 trillion dollars or 100% of GDP. Tax rates are likely to go higher to pay for past spending, increasing entitlement programs, and massive infrastructure needs. The expiration of the Bush tax cuts in 2013 is likely a turning point in a new trend towards higher tax rates in the United States. Tax‐free municipal bonds continue to offer a safe haven from taxes and should perform well in a rising tax‐rate environment.


