Long Munis outperformed US Treasuries and Corporate bonds last quarter.
Review
The table below shows returns for the 1st quarter for a variety of Merrill Lynch Bond Indices. Intermediate Tax Free bonds lagged longer bonds as the yield curve flattened. Junk bonds, which have a high correlation to equities, also did well but lagged long Munis by a wide margin.

Muni Yield Curve Flattens
The chart below shows the steepness of the Muni curve for the 5‐10 year part of the yield curve. During the quarter yields rose slightly in the 5 year part of the curve while yields fell about 28 bp’s in the 10 year area for a “flattening” of the curve.
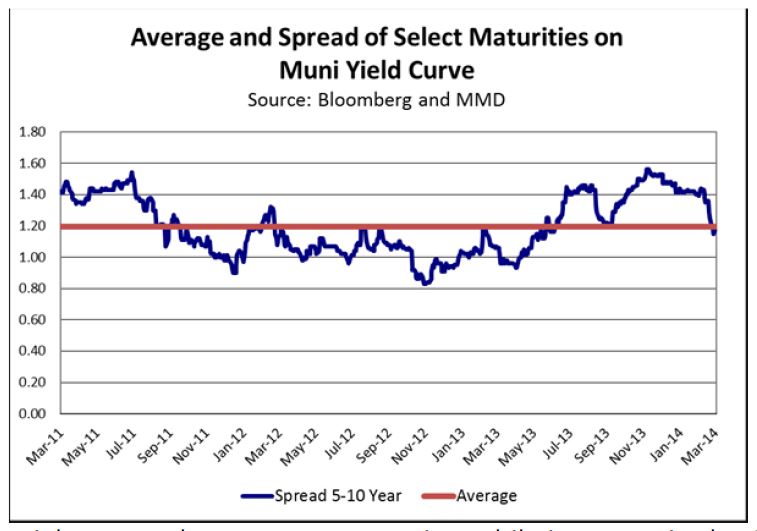
Investors in the 5 year area became worried the Fed might cause short term rates to rise, while investors in the 10 year area took advantage of the extreme steepness available in the curve for extending maturities from 5 to 10 years. This pick up in yield was at historic wide spreads at the beginning of the year and is now back to the average for the last 3 years. This has been what is called a bear flattening move.
Factors Contributing To Long Muni Outperformance
The long end of the Muni market has been aided by 3 different factors. First, the Fed has raised expectations, through forward guidance, of potential rate increases in the Fed Funds rate beginning next year. This has led investors to want to “sell” the 3‐5 year part of the curve and “buy” the longer part of the curve. This is known as a bear flattening trade, and is usually duration weighted by using a barbell strategy. This strategy might consist of bonds due in 1 year and bonds due in 10‐20 years. The idea is that the low yields for 3‐5 year maturities have more potential to increase faster relative to the much higher yields available in 10‐20 year maturities. Next, the mutual fund and ETF outflows from last year have stopped, and investors are now putting some money back into these funds. These funds are primarily yield oriented which lends support to the long end of the market. Since the baby boomers are coming into retirement age, we expect the demand for income producing assets to continue to be relatively strong. Finally, there is a shortage of Muni bonds coming to market. Issuance year to date is down over 25% from last year’s numbers. We expect the supply of Munis this year to be significantly less than normal, because refunding’s are down almost 40% from last year’s levels. Higher marginal tax rates and a shortage of supply provide good technical’s for the Muni market going forward.
Portfolio Structure & Security Selection
We believe a barbell strategy will most likely outperform laddered strategies for the balance of the year. Today’s very steep yield curve and interest rate environment makes this strategy desirable. We manage our portfolios for total return. Total return for fixed income portfolios consists of the return from income, and the return from price changes in the portfolio. We have had a focus on increasing the income component of our portfolios. We believe this will be increasingly important in achieving higher total returns this year. This emphasizes security selection as a driver of returns. We are currently finding value in investment grade securities which are trading at wider spreads to AAA rated bonds. These securities are typically revenue bonds with dedicated revenue streams to pay debt service. In general, we have been avoiding general obligation bonds for big cities, and municipalities which are under financial and/or budgetary stress such as Puerto Rico, Detroit, or North Las Vegas.
The Fed & Forward Guidance
The traditional tool for the Fed has historically been managing the Fed Funds rate. They have encouraged economic growth by lowering the rate, and have slowed growth by raising the rate. Since the financial crisis in late 2008 the Funds rate has been between 0%‐.25%. This policy tool has not worked because the economy has been in a liquidity trap. The system is overleveraged, and there is a greater desire on the part of borrowers to deleverage, than to increase borrowings. Since it is not possible to create a negative funds rate, the Fed has resorted to other tools to create additional stimulus in a zero bound interest rate environment. These tools are designed to keep long term interest rates low to stimulate growth. One of these tools is Quantitative Easing (QE) which is when the Fed expands its balance sheet by buying bonds in the open market. There is some evidence this tool has become less effective, and the Fed is tapering its purchases of securities. The other tool is called Forward Guidance. Through Forward Guidance the Federal Open Market Committee (FOMC) provides an indication to the public about the stance of monetary policy expected to prevail in the future. This is similar to “jawboning” where the Fed talks down long term rates now by giving guidance about future rate actions by the committee. There are 16 members of the FOMC. Each member makes forecasts regarding when the first increase in the Funds rate will occur and where they think the Fed Funds rate should be for different time periods in the future.
Connecting The Dots
The chart below shows the forecasts by the 16 members of the FOMC from the March 19, 2014 meeting. There is consensus to keep rates low through the rest of 2014, but the vast majority see rates higher by the end of 2015, and all members see rates higher by the end of 2016. Yellen recently commented that rates would stay low through the middle of next year.

When asked about the “dots” moving higher she said we should not pay too much attention to the dots (even though the Fed is publishing them to give us guidance.) Her dovish comments have created uncertainty in the markets and question the usefulness of Forward Guidance.
Forward Guidance Has Limited Value
We are in agreement with Yellen about the value of watching the dots. The Fed has been providing guidance for the last 5 years. They have consistently over‐estimated the growth rate in the economy, and over‐estimated inflation. The dots have been showing rate increases coming for the last 2 years. We believe it would be better to focus on the growth rate of the economy and inflation expectations. The chart below shows projected economic growth by the same 16 members of the FOMC. They have overestimated growth for this year and show it peaking at the end of next year. They are forecasting growth in the longer run of 1.8% to 2.4%. These forecasts of sub‐par long term growth and significantly higher short term rates are inconsistent with each other. During the last few years the Fed has expanded its balance sheet and fought diligently in an attempt to get growth up to trend. It seems unlikely they will raise rates when growth is even slower in the future.

Japan has experienced sub‐par growth and low interest rates for the last 20 years. Past and current Fed action has likely drawn out the process of deleveraging in our country and will lead to below trend growth and relatively low rates for a long time. This should provide a favorable environment for bonds.