The events of 2020 changed our world in many ways, leading to major economic shifts that we are still feeling today. To stabilize the economy, the Federal Reserve dropped rates to near zero, and $8 Trillion was handed out to keep business and households afloat. This, along with many other factors, played a role in supply-demand imbalances, causing inflation to rise.
Over the past 3 years, we have seen yields rise dramatically to fight inflation. The 2-Year Treasury, which was hovering around 15 bps in mid-2020, has surged to over 5% in 2023. The 2-Year/10-Year inversion began July 5th, 2022, and has remained inverted. The chart below shows the dramatic rise in rates.
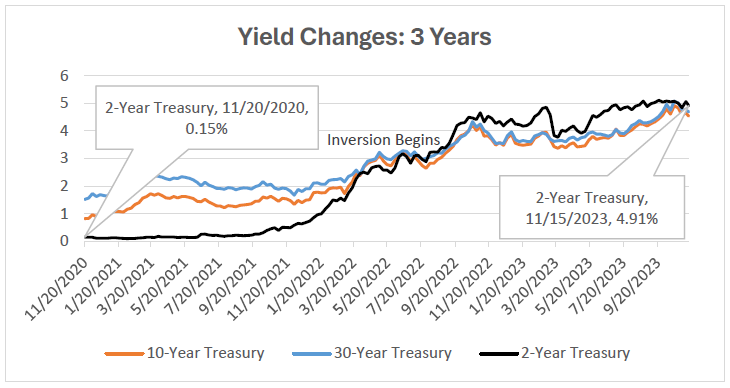
Source: Bloomberg
In March of 2022, the Fed began raising rates at a pace we have not seen in any of the past 5 hiking cycles. As seen below in red, the Fed’s upper bound rate rose 525 bps in 20 months. None of the past hiking cycles since the 70’s have raised rates as quickly as this. This tightening in the economy caused major problems in the banking sector in March and has brought continued tightening conditions in the housing and financial sectors. The massive amount of stimulus coupled with the break-neck pace of tightening leads to many questions about the strength of the economy and the consumer. While we are now in a waiting period with long and variable lags, we believe we are at or near peak rates.
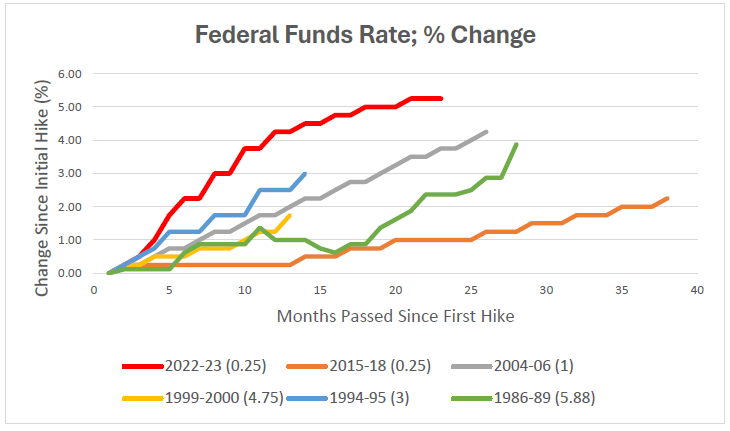
Source: Bloomberg
3-Month/10-Year Inversion

Source: Fred https://fred.stlouisfed.org/series/T10Y3M
The chart above shows the past 4 times the 3-Month T-Bill has yielded more than the 10-Year Treasury for a sustained period (90 days). This is called a yield curve inversion. The past 3 occurrences of an inversion like this, there has been a recession. From left to right (above), the length of the line is the number of days from the beginning of the inversion to the beginning of the recession. The red line is where we are now. We have had the deepest inversion on record and are at 384 days and counting. We have been inverted longer than 1989-90, 2000-01 and 2006-07. As shown above, a recession has never happened until after the curve de-inverts meaning we have more time to wait.
What does this mean for the U.S. and the economy? We wish we knew the future. The depth of the inversion does not necessarily equate to the depth of the recession. However, we remain skeptical that we can avoid a recession and believe there will be weakness moving forward. Jerome Powell seems ‘resolute’ to bring inflation back down to 2%. While inflation is coming down, this takes time. This means that these restrictive rates will continue to tighten the economy and put pressure on businesses, many sectors of the economy, and the consumer.
The Consumer Appears Stretched
Consumer spending makes up roughly 2/3’s of the U.S. economy and GDP. The consumer is the engine that powers our economy. After being super-charged with stimulus over the past 3 years, the consumer now appears to be getting stretched. Below is the U.S. Personal Saving as a % of Disposable Personal Income over time.
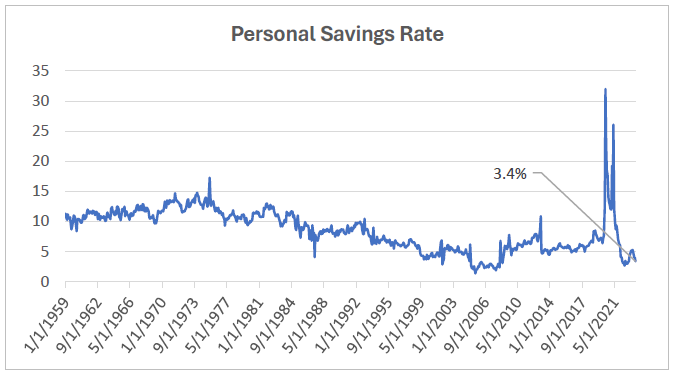
Source: Fred
1960-1980: Consumer saved 11.7%
1980-2000: Consumer saved 8.3%
2000-2020: Consumer saved 5.6%
Currently, the consumer is saving 3.4% of their disposable personal income. We are hovering around levels that we have not seen since 2005-08. According to a survey by the First National Bank of Omaha, 47% of adults say, “their monthly expenses exceed their monthly income” and 57% are living paycheck to paycheck.
Subprime auto loan delinquency rates (below) are at an all-time high. This measures the percentage of subprime auto borrowers at least 60 days past due on payments. Transition into serious delinquency (90 days+) for auto loans for all buyers ages 40 and under are also approaching levels from the GFC. High auto loan rates – sometimes rising as high as 29.99% - are making it increasingly difficult for consumers to make payments.
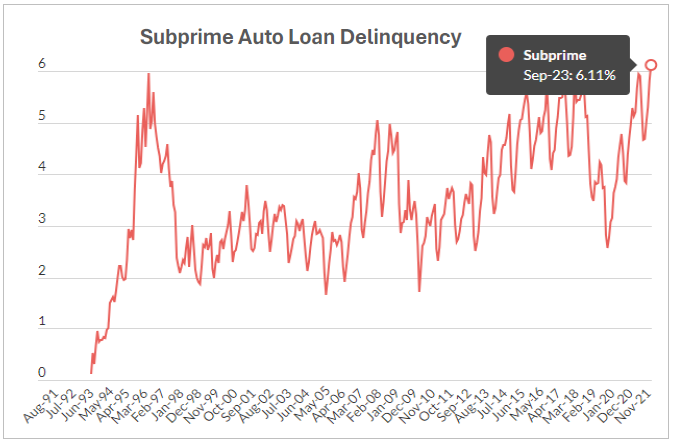
Source: Federal Reserve Bank of New York
Americans’ credit card debt also rose above $1 Trillion for the first time in history in Q2. We are spending more than we have and are saving less. How long can this persist? No one knows but we do believe borrowing will continue to go up through the holiday season, limiting the ability of the consumer to make purchases in the future, leading to more stress in the future.
Budget Process is Broken
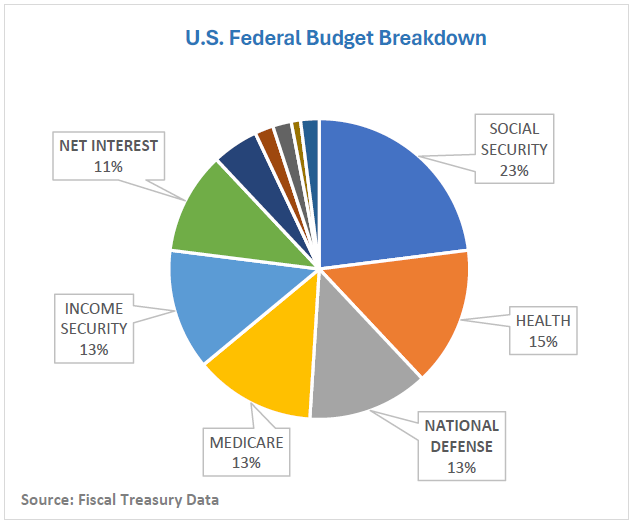
The chart above shows a breakdown of major budget categories for the U.S. Federal Government. Interest costs for the Federal Budget are ballooning because of the rise in interest rates caused by Fed tightening and massive deficit spending of over $1.5 trillion during an economic expansion by the current administration. Net interest costs are now roughly the same as expenses for Medicare and National Defense. For perspective, the U.S. spends more on defense than the next 10 countries combined according to the SIPRI Military Expenditure Database.
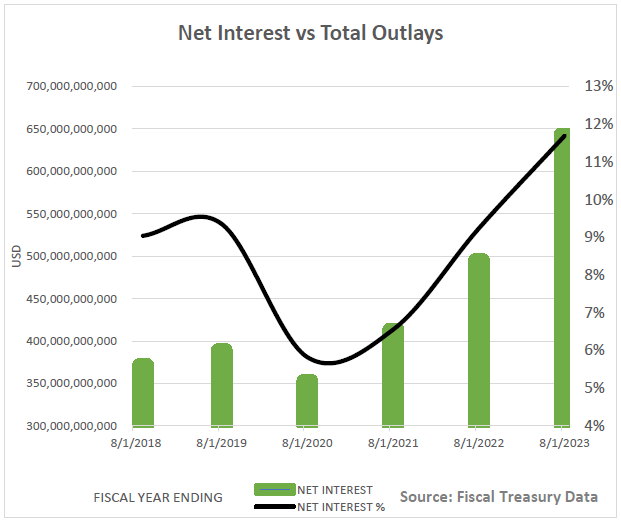
The chart above illustrates the rapid rise in interest costs. During the last 3 years, interest costs have more than doubled from about 5.5% to 11.0% of the budget. This trend is clearly unsustainable. We expect fiscal policy to become more of a headwind for the economy going forward as policy makers grapple with this serious issue. The existing political polarization and the removal of the Speaker of the House for the first time in history further demonstrates the difficulties we are facing. Removal of this massive fiscal stimulus should provide a more favorable environment for bond holders as the economy slows.
Conclusion: Time to Lock Up Peak Rates
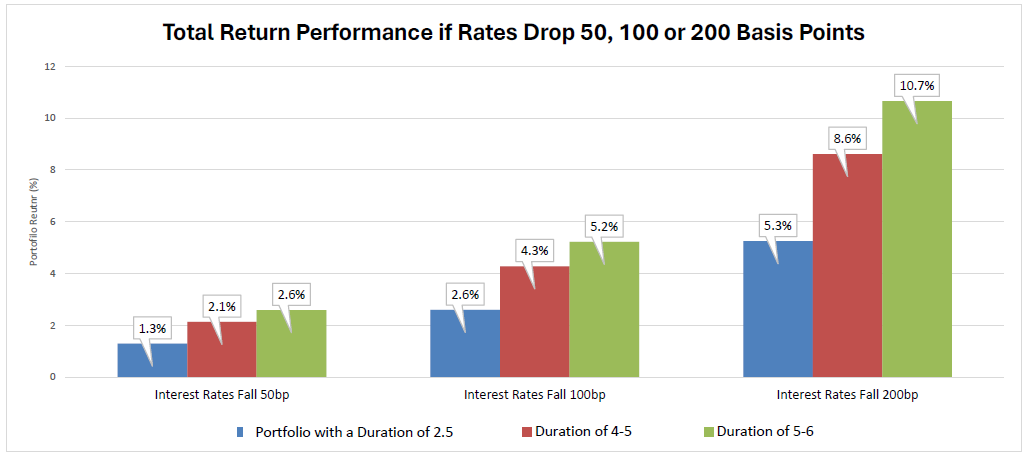
We are continuously looking for ways to optimize our clients’ portfolios. We have been implementing tax-loss harvesting strategies in portfolios now for about 2 years as rates have risen. We have been trying to improve credit quality now that higher yields are more easily found. The other main thing we have been trying to do whenever it is in the client’s best interest is to extend the duration of the portfolio and position for falling yields. The chart above illustrates the risk of maintaining a duration too low in this environment. If yields fall and your duration is at 2.5, the underperformance will be concerning. We continue to extend.
We believe we have seen the high in yields for this cycle. The 10-Year Treasury recently dropped 50 bps in 1 week from October 26th to November 3rd in hopes that the Fed is done raising rates and that we will have a soft landing. This type of drop is not out of the ordinary. The 10-Year dropped 200 bps in a 2 month span in 2008. It dropped 150 bps in 2 months in 2020.