Rates continue to rise, quantitative tightening has been running for 4 months, and CPI is remaining around 8% YoY. While consumers and investors hope that inflation is easing, the FOMC continues to point to more rate hikes in December and beyond depending on the data. All these factors have weighed heavily on markets in 2022. Forced selling in Muni bond funds continue to create great buying opportunities for individuals looking for tax-free bonds.
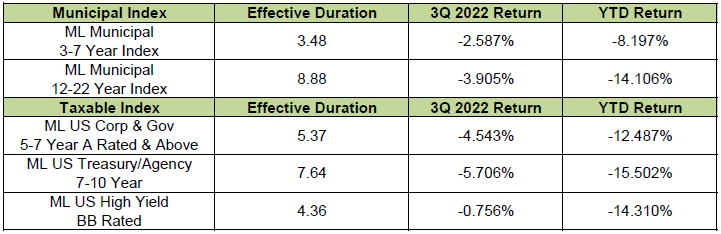
The table below summarizes the returns of a few major fixed income indices.
Fed Funds Cyclical Tightening Comparison
The Federal Reserve recently raised the target range for the Federal Funds Rate to 3.75-4.0%. Jerome Powell and other members of the committee continue to remain firm that they would rather overtighten than loosen prematurely. As seen below, the high end of the Fed Funds Rate has risen by 3.75% in only 10 months this year. It took 28 months to come up a similar amount from 1986-89. It took 26 months for the Fed Funds Rate to rise 4.25% from 2004-06. We will most likely see this rate rise to 4.25-4.5% in December – in a span of 11 months. This rapid rise in rates has had dramatic effects on different sectors of the economy. Layoffs are being announced broadly in the tech sector and housing demand has cooled swiftly.
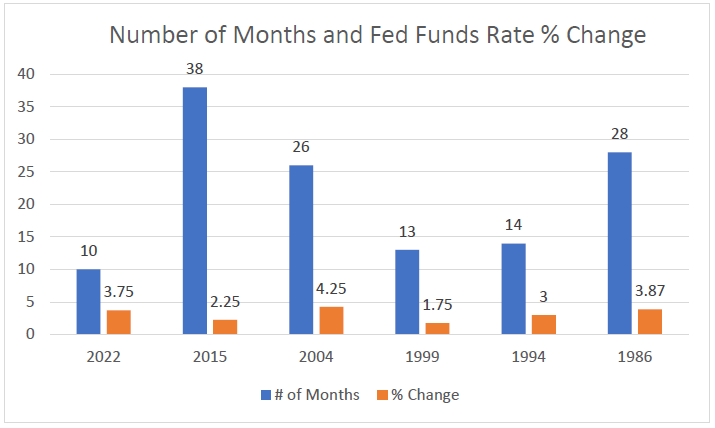
Source: Bloomberg
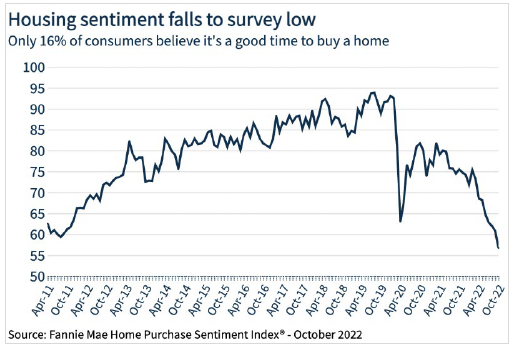
Fannie Mae Home Purchase Sentiment
Along with home prices, housing sentiment has also dropped as seen below. According to Fannie Mae, the Home Purchase Sentiment Index (HPSI) decreased for the 8th consecutive month dropping to an all-time low of 56.7 since they began tracking data in 2011. With 30-Year Mortgage Rates hovering near 7%, homes are staying on the market longer and home buyers have turned negative after being priced out by rates. 30-Year Mortgage rates were at 3% 1 year ago. According to the HPSI, 80% of respondents said it is a “Bad Time to Buy.”
Yield Curve Inversion
We have a Probit model which we have used for many years to predict recessions. The model is based on the works of Jonathan Wright and uses yield curve inversions to forecast periods of economic weakness. A yield curve inversion signifies credit conditions becoming “tighter.” The model below compares the yield on the 3-month UST bill to the yield on the 10 year UST bond. The probability of recession increases when the yield of the bill becomes higher than the yield of the bond. This model correctly predicted the recession caused by the Great Financial Crisis about 15 years ago. The next signal was given before the COVID shutdown in March of 2020. It is currently forecasting over a 30% chance of a period of economic weakness within the next year. There are already warning signs of an economic slowdown in the technology and housing sectors with economic distress and layoffs.
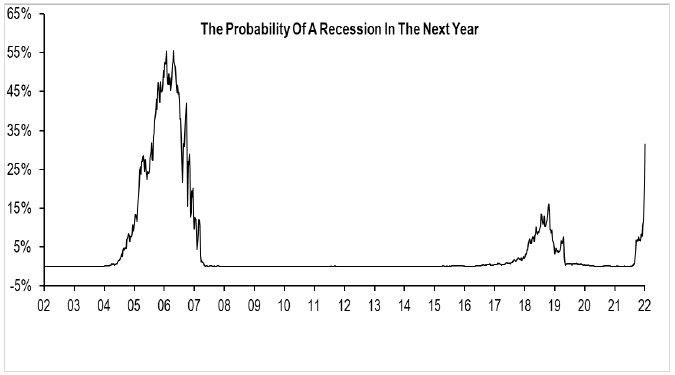
Probit Model based on Jonathan Wright’s Research Model
UST Breakevens

Source: Bloomberg
The chart above compares the expected Breakeven Rate for inflation compared to the yield on the 10-year UST. The breakeven rate is calculated by taking the yield on a 10-year Treasury Inflation Protected Security (TIPS) and subtracting it from the yield on a 10- year UST. The chart shows the bond market currently expects inflation to average about 2.40% over the next 10 years. UST yields have historically been attractive when they yield 50-100 bp’s more than the breakeven rate. We believe the 10-year UST is attractive for long term investors since yields close to 4.0% are more than 125-150 bp’s higher than the breakeven rate.
Current Muni Opportunity
There has been relentless selling of Muni Bonds by mutual funds this year to meet redemptions for holders of their funds. The chart below from Lipper shows the cumulative effect of these redemptions during the year. These funds have had total net outflows of about $120 Billion this year. This along with the rise in UST yields has put considerable pressure on the Muni market and has caused yields to rise significantly. Quality spreads have also widened across the curve. Much of the forced selling has come from High Yield Muni funds. Many of the bonds they have been selling are lower investment grade rated and are down in value 20-30% since the first of the year. It is almost always good to be on the other side of forced selling, and we have seen many funds forced to sell to meet redemptions – this has created excellent opportunities for us on the buy side. We have sought to take advantage of this opportunity by buying credits we like at levels we believe are attractive. Further, we believe this is a great window to extend duration and buy munis, as yields are higher than they have been in over a decade.
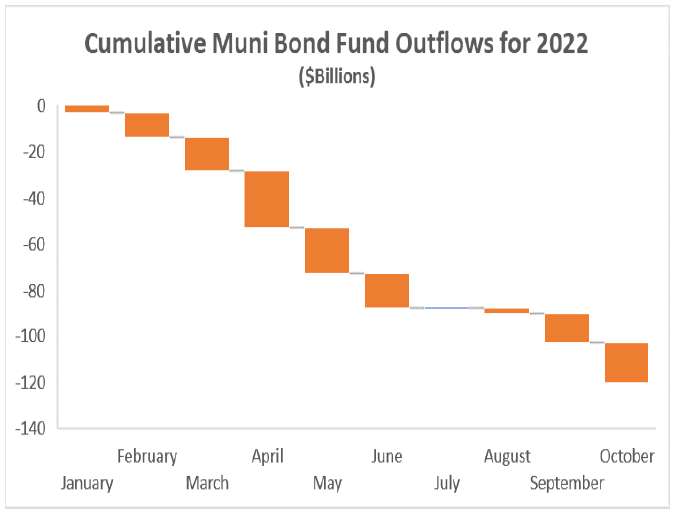
Source: Lipper
Conclusion: A Buy Window for Bonds
We believe US Treasuries are attractive with the 10-year UST 125-150 bp’s over the breakeven rate. While 4% Taxable yields are attractive on UST’s, we have been buying 10-year Munis cheaper than 4% Tax-Free, which would be Tax-Equivalent yields somewhere between 6.5-8%. Yields are higher on Munis than they have been in a decade. Being on the buy-side of forced selling has allowed us to do a lot of tax-loss harvesting for clients, re-invest in higher yields, and extend duration for clients.