Rising rates, quantitative tightening, and inflation all weighed heavily on fixed income markets in the first half of 2022. High Yield was affected the most as credit spreads widened dramatically. Forced selling in Muni bond funds created a great buying opportunity for individual tax-free bonds in the 2nd Quarter.
The table below summarizes the returns of a few major fixed income indices.

Consumer Sentiment

Source: Bloomberg
The University of Michigan Consumer Sentiment Survey Index (above) hit an all-time low of 50.0 in June, 2022. The previous low was 51.7 in 1980 and only fell to 55.3 during the financial crisis. 47% of respondents “blamed inflation for eroding their living standards.” (see link below for full quote) This alarmed the Federal Reserve Board and urged them to raise rates 75 bp’s at each of their past 2 meetings. It increased the urgency for the Fed as consumer spending makes up roughly 70% of the economy and when sentiment dips to these levels it is a red flag for the economy moving forward. While the Fed has maintained that home and business balance sheets remain strong, this demonstrates the consumer is feeling the effects of inflation as CPI and PCE YoY both hit new 40-year highs at 9.1% and 6.8% respectively. (https://data.sca.isr.umich.edu/fetchdoc.php?docid=70332)
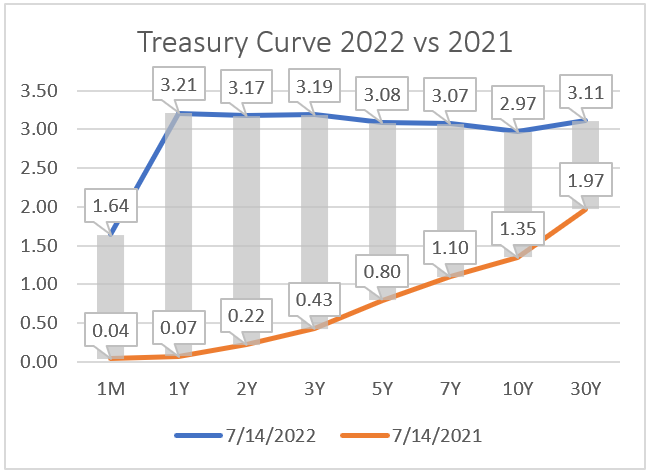
Yield Curve Inversion
The U.S. Treasury yield curve has remained inverted for many weeks and the depth of this inversion we haven’t seen since the early 2000’s. Normally, investors would like to be paid more for locking up their money for longer periods. However, with the curve inverted, short term rates have risen on the shorter end of the curve more than on the longer end. For example, the chart below captured the curve on 7/14/22. An investor could get 3.21% by locking up their money for 1 year and only 2.97% for locking up their investment for 10 years.
Source: Bloomberg
Looking forward, we do not believe this is a good sign for the economy. A yield curve inversion has preceded every recession when comparing the inversion of the 2 vs 10 yields (see chart below). While NBER has not officially labeled our current period a recession, GDP came in negative for the 2nd consecutive quarter and, in our view, still faces many headwinds moving forward.

Source: Federal Reserve Bank of St. Louis
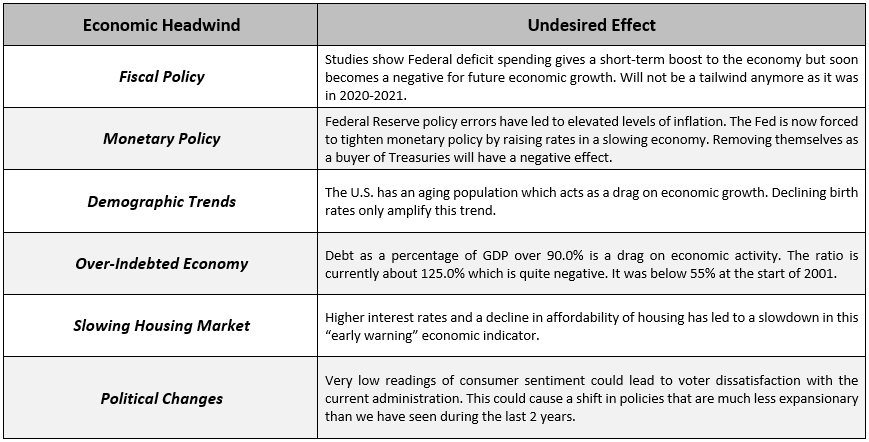
Headwinds for the Economy
The economy has already been slowing and may face significant headwinds during the next few years. The table below shows these negative forces the economy needs to overcome to avoid sub-par growth in the future. We feel it is very unlikely that the economy can grow above trend due to these headwinds. Our research shows interest rates are highly correlated to the growth rate of the economy. Slow or negative economic growth will lead to lower levels of inflation and lower interest rates in the future.
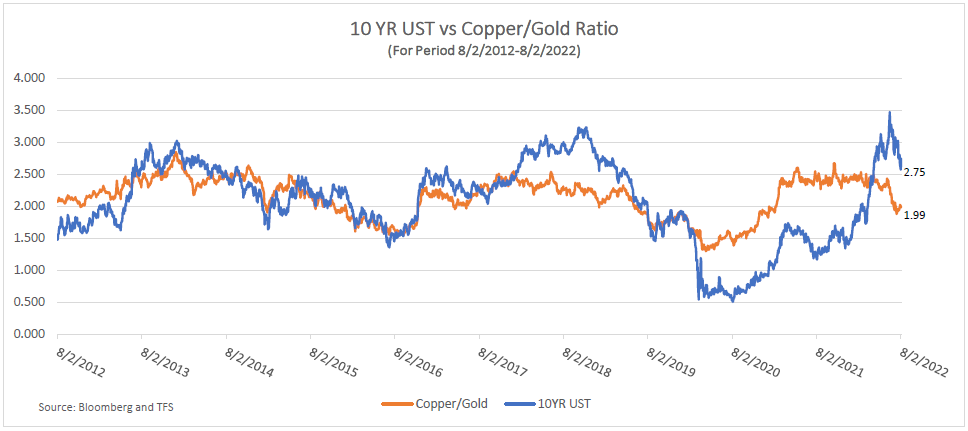
10 Year UST vs Copper/Gold Ratio
The Copper/Gold ratio has historically been a leading indicator for the 10 Year UST yield. The price of copper, an industrial commodity, is a good measure of the strength of the economy, and the price of an ounce of gold is a good measure of the value of the store of wealth. The ratio of these two commodities tends to act as a good indicator for the direction of interest rates. The chart below shows the relationship between the two data sets. The Copper/Gold ratio has been trending lower and suggests the yield of the 10 YR UST should be 1.99%. Since the 10 YR UST currently yields 2.75% this indicator shows that bonds are attractive and undervalued. Copper is acting as a proxy for future economic growth, and it is confirming the slowing demand shown by the last 2 negative quarters of GDP. This indicator shows a “risk off” approach to financial markets is currently warranted. This trend should continue until the Fed has done enough damage to the economy to warrant a change in monetary policy to get things going again.
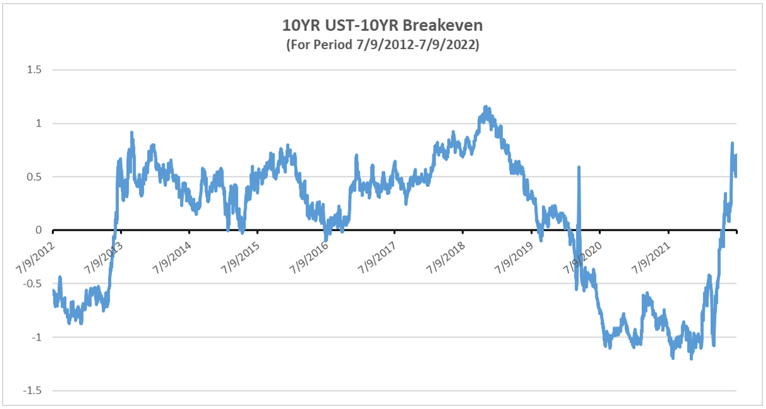
10 Year UST vs Breakevens
The 10 YR UST currently yields about 2.75% and the breakeven rate is 2.48%. This means the bond market believes inflation will average about 2.48% during the next 10 years. Since the 10 YR yields 2.75% we can say the bond is trading about 27 bp’s more than the breakeven rate. During the period from early 2020 until May 2022 the 10 YR traded at a yield which was less than the breakeven rate. For much of this time it traded about 1.0% less than the breakeven rate. This measure tells us bonds are currently more attractive vs. expected inflation over the next 10 years. During the last 10 years bonds were attractive when they yielded 50bps to 100 bps more than breakevens. We feel we are approaching levels where bonds are fairly valued using this measure.
Source: Bloomberg
Tax-Loss Harvesting is Back
During the favorable market for bonds during the last 2 decades most of our investors had gains in their portfolios. This made it difficult to harvest losses. The rise in rates during the last year has created an opportunity for bond investors to harvest losses in their non-deferred accounts. Tax swaps (or harvesting losses) are executed by selling one security which has a loss and buying another security which has similar characteristics without impairing his/her position. This allows the investor to realize a tax loss (and reduce their tax bill) while retaining similar market exposure.
The Muni market is a good place to do these swaps because there are many different issuers which have bonds with similar characteristics. These losses can be used to offset gains in other parts of the investor’s portfolio. If the taxpayer does not have any gains, $3,000.00 can be used to offset current income and the balance can be carried forward to use against future gains. This harvesting strategy is a great value add for our clients and we have been doing these trades when we can get favorable execution.
Conclusion: The Case For Bonds
The economy has had 2 consecutive quarters of negative growth. High levels of inflation have caused consumers to become very negative about the economy as the cost of necessities has outpaced their rising incomes.
This squeeze on their finances has already led to an economic downturn. In addition, there are significant factors which are creating headwinds for the economy. It will be exceedingly difficult for the economy to grow in this environment. This makes it likely that we are experiencing peak inflation now. Breakevens and the 10 Year UST vs Copper/Gold ratio are suggesting rates are now at attractive levels.