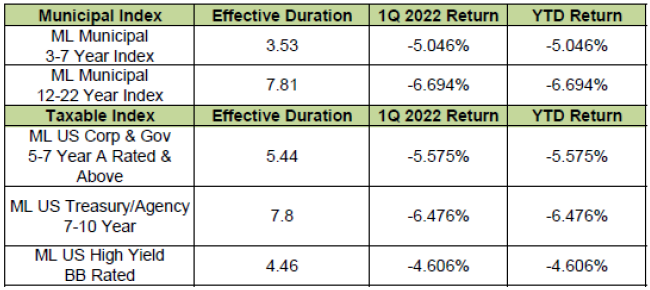
The 10-year Treasury yield rose from 1.66% to 2.90% - a rise of 75% since the beginning of the year. The 10-Year yield has doubled since December 2nd. The Consumer Price Index (CPI) is running at 8.5%, the Personal Consumption Expenditure Deflator (PCE), the Fed’s preferred inflation gauge, is 5.3%. Both are at the highest readings since the early 1980’s. S&P CoreLogic Case-Shiller National Home Price Index was up over 20% year over year. The housing market in Phoenix was up 32.9%. Wages have been increasing, but are not keeping up with inflation. Fixed Income markets were all sharply lower as high inflation and the prospect for quantitative tightening began to weigh on fixed income markets.
The table below summarizes the returns of a few major fixed income indices.
Inflation
We have studied the growth of the money supply and resulting inflation. The chart below shows a high correlation between the growth of M2, and inflation with a one year lag. The peak in year over year growth of M2 was on 2/28/2021 at an almost 27.0% annual rate. Since then the growth of M2 has been falling steadily. Based on this relationship we expect peak inflation to be in this current time frame, and for the rate of inflation to moderate over the rest of the year.

Source: Bloomberg
Our research also shows inflation tends to be highly correlated to the growth rate of the economy. We closely monitor the Chicago Fed National Activity Index as a barometer of inflationary pressures rising from the growth rate of the economy. This index consists of 85 indices which measure production and income, employment and hours worked, personal consumption and housing, and sales and inventories. The index has shown inflationary pressures emerge when the economy is growing strongly above trend. The current reading of the index is not showing cause for concern.
The size of the fiscal and monetary response to COVID has surely been unprecedented compared to past economic downturns. The fiscal response was more than ten times greater than the response during the Financial Crisis and the amount of liquidity the Fed provided was enormous. This created quite a tailwind for the economy and the markets. Looking forward, fiscal and monetary policies are both expected to provide headwinds for the economy. This should lead to lower rates of inflation and lower rates over time.
Munis Are Attractive
Since the middle of last year, Munis have cheapened dramatically. There has been a huge parallel shift in the yield curve. The chart below shows this shift. The yields are shown on the left side of the graph. The one year AAA rated Muni yield has gone from almost zero last July to almost 2.00% now. This is an incredible move considering the Fed has only recently raised the Fed Funds rate 25 bp’s to 0.50%. The vertical bars show the size of the change for each maturity from one to thirty years. The amount of this change is shown on the right side of the graph. For example, a Muni in thirteen years has risen about 175 bp’s in yield.

Source: Bloomberg
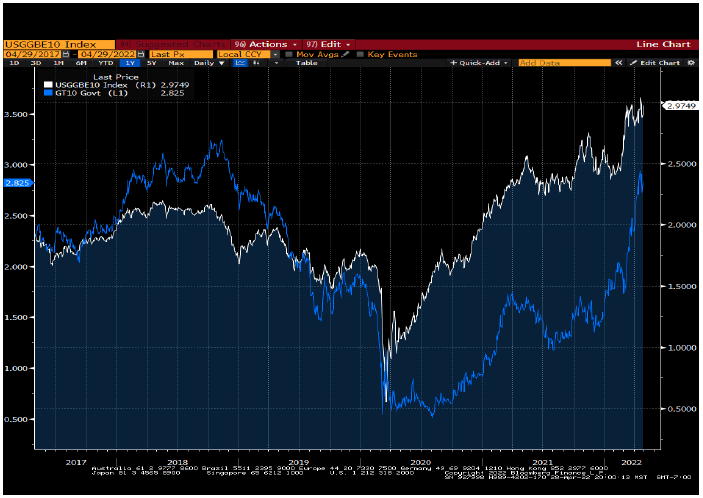
Since we seek to maximize after tax income for our clients, we also like to look at tax free yields compared to UST which provides taxable income. The chart below shows this ratio has gone from about 55% to almost 100%. This means Munis are much more attractive compared to treasuries today. The chart below shows the 10 Year AAA Muni yield as a percentage of the 10 year UST. Munis have cheapened versus treasuries significantly and are now very attractive.

Source: Bloomberg
Us Treasuries and Breakeven Rate
The 10 Year UST has historically been highly correlated with the 10 Year Breakeven rate. The breakeven rate shows the market expectation for the average of inflation over the next 10 years. The current expectation is about 3.0% (seen below). Since we feel we are at or near peak inflation, we would make the case breakevens are near or at the highest point for this cycle. That would imply the 10 year is approaching an area which is attractive.
Source: Bloomberg
We also like to look at the yield curve to see what it is telling us. The chart below shows the spread between a 3 month UST and the 10 year UST. This spread is shown on the right side of the graph and is about 200 bp’s. Since the Fed is planning to raise the Fed Funds rate 50-75 bp’s at the next meeting, we would expect this spread to begin to narrow. The chart also shows this spread compared to the change in the Funds rate. The rise in the Funds rate is certainly in a downtrend. We believe that is because the economy is so highly leveraged that it takes less of an increase in the Funds rate to cause stress in the economy. We believe this time will not be different. We would be surprised to see short term rates get higher than 2.0%, because the economy will not be able to absorb rates much higher than 2.0%.
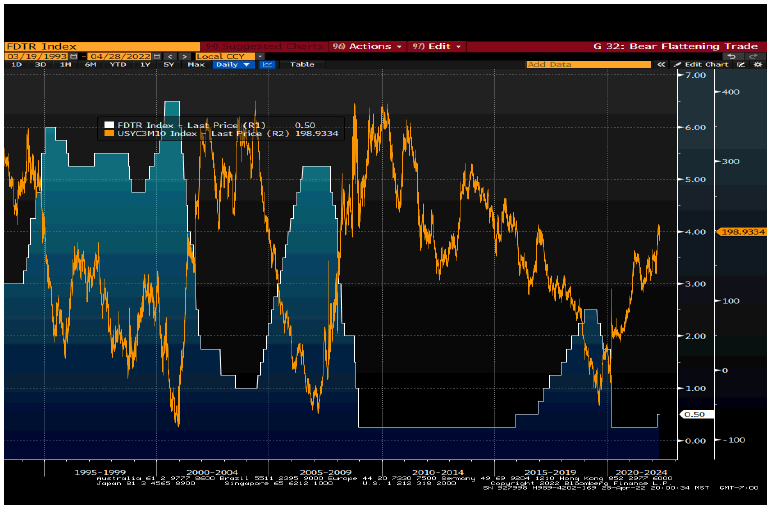
Source: Bloomberg
Forward Guidance and Headline Risk
The Fed has ramped up the use of forward guidance to accomplish their objectives. This should be clear since the first of the year. There has been a major shift in the rhetoric or noise coming from the Fed. For example, last year their mantra was, “inflation is transitory.” Recently that mantra has shifted to, “we are going to raise rates and rapidly use Quantitative Tightening (QT) to get inflation under control.” Investors need to remember that forward guidance is just a tool for the Fed to use. Their actions should always be data dependent. If the economy slows and inflation subsides, the Fed will back off on their tightening and this rhetoric will soon be forgotten.
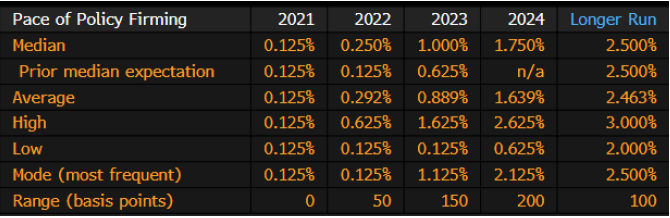
Below is the guidance for the Funds rate from September 22, 2021, which was only 7 months ago. The average forecast for this year (2022) was 0.292% and the forecast for next year was 0.889%. However, the data changed and so did the noise coming from the Fed. This forecast for this year is already wrong. It is also highly likely the Fed will be wrong again with their current forecast.
Source: Bloomberg
What is the current forecast? On March 16, 2022 the Fed gave the forward guidance shown in the table below. They are now forecasting a Funds rate of 2.05% for this year with one member saying rates will be as high as 3.125% and another member saying they will only go up to 1.375%. We would caution investors to pay more attention to the data as it comes in, and less attention to the noise coming from the Fed. We don’t believe the economy can handle rates that are very high without slowing down or slipping into recession.

Source: Bloomberg
Conclusion
Inflation has been high and the Fed has been using forward guidance to persuade the markets they are now finally armed and ready to do battle against inflation. They have convinced the markets that higher rates are needed to get price increases down to their target of 2.0%. This has led to a significant rise in rates along the curve since the first of the year, even though the Fed has only raised the Fed Funds rate 25 bp’s so far. For example, the 2 year UST has risen about 200 bp’s since the end of last year. This has made UST and Corporate bonds attractive. Tax free bonds are even more attractive. Now is a good time to add to fixed income positions.
We are coming to the end of this economic cycle. The economy is already beginning to slow down and policy makers are no longer able to use fiscal and monetary tools to generate above trend economic growth. The odds of a recession are increasing. We believe we are at peak levels of inflation, and price increases will begin to subside. The economy will continue to slow, and interest rates will trend lower later in the year. As inflation is tamed and the economy weakens it will become clear that the Fed will not need to raise rates very high to accomplish their goal of price stability. The rate increases that are built into the bond market will likely not be seen. We don’t believe the highly leveraged world economy can handle very high rates.