Fixed income sought direction in the third quarter as investors absorbed news regarding potential tapering, continued stimulus, the debt ceiling, and an ever present debate regarding the magnitude and duration of inflationary forces.
The Ten-year treasury yield fluctuated widely, starting the quarter at 1.47%, dropping to a low of 1.17%, then rising back to 1.48% to end the quarter almost exactly where it started. Municipal bonds and high yield remain positive for the year, with long duration underperforming short.
Review
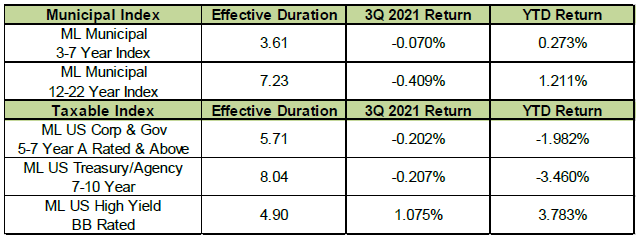
The table below summarizes the returns of some fixed income indices:
The Fed’s Dual Mandate
The Fed has historically had a dual mandate. They have a goal from Congress of maximum employment consistent with stable prices. The current unemployment rate is 4.8%. This is below the average since 3/31/1948 of 5.8%. It is also way below the COVID cycle peak of 13.07% reported on 6/30/2020. We believe it is reasonable to conclude the Fed has accomplished this part of their goal by getting the unemployment rate down to this level. However, it is important to remember this Fed is very dovish and seem reluctant to end this period of extreme monetary accommodation.
The Fed’s preferred measure for inflation is the U.S. Personal Consumption Expenditure Core Price Index (PCE). This index has averaged 1.8% over the last 20 years and 3.2% since inception on 1/1/1960. The Fed has been targeting a 2.0% rate for PCE for some time, but is now willing to overshoot this target since increases in inflation are being viewed as transitory. This index is currently 3.64% which is considerably higher than it has been for the last 20 years. The Fed has been telling the markets they still believe inflation will slow down once supply chain issues work their way through the system.
Even though tapering will commence this month, Fiscal and Monetary policies continue to be stimulative amidst growing supply chain issues. There are shortages of materials, computer chips, and labor. The Bureau of Labor Statistics reports there are over 10 million jobs available in the U.S. and labor prices have been rising accordingly. Freight prices have been increasing. There is congestion at ports and difficulties getting shipping containers moved. Commodity prices have also been rising. Oil prices are up to over $80.00 per barrel for oil. Rent and housing prices have been in a strong uptrend. These have all combined to put upward pressure on inflation. Inflation has historically lasted longer and risen more during periods where there are shortages. It will be interesting to see if inflation continues to run hot since the Fed and markets are always data dependent. If the Fed is forced to accelerate tapering and has to raise rates earlier than expected, it could be a problem for the economy since it is so highly leveraged it will not take much to slow it down.
The Taylor Rule as a Measure of Fed Policy
The Taylor Rule has historically been a formula that gives an indication of where one can expect the Fed to set the federal funds rate based on their dual mandate.
The Taylor Rule can be written as:
Fed Funds = Neutral Real Rate + Inflation + [.50 × (Inflation – Target)] + [.50 × 2.0 x (Output Gap)]
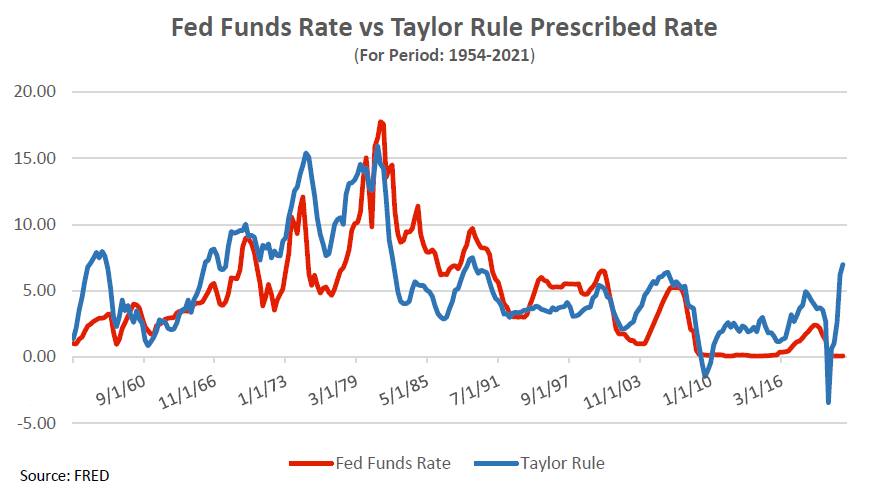
where the variables are the neutral rate and inflation target, inflation is year over year, and the output gap is a measure of how close the economy is to producing at potential. The Taylor Rule prescribes that the Fed anchor the federal funds rate at the neutral interest rate plus inflation. From that anchor, the Fed should raise the funds rate by 50 bps for each percent that inflation is above target and for each percent that the economy produces above potential (and vice versa). Historically the Fed has used a neutral rate of 2.00% and an inflation target of 2.0%. If we use these numbers for our variables the formula would look like this and would currently call for a Fed Funds rate of 6.6%:
6.66%=2.00% + 3.64% +[.50*(3.64-2.00)]+[.50*2.00*(5.00-4.8)]
The current Fed Funds rate is 0.00% not 6.66%.The reason for such a discrepancy between the current Funds rate and the Taylor Rule rate is the Fed currently has a different set of underlying assumptions about inflation and unemployment. For example, they believe the current inflation rate of 3.64% is temporary and will decline over time when supply chain issues get resolved. They also believe we are not really at full employment. This is why they are continuing an easy money policy and keeping rates at the zero bound. We will be monitoring inflation and GDP data closely to see if their assumptions are correct. The high levels of debt in the economy makes it difficult for the Fed to raise rates significantly. The chart below shows the Taylor Rule model expected Funds rate compared to the current Funds rate since 1954.
The Fed’s Balance Sheet and Quantitative Easing
During the Financial Crisis in 2008, the Fed realized it could not be accommodating enough by employing traditional monetary tools such as the Fed Funds rate. Fed Chairman Ben Bernanke and team came up with the idea of expanding the Fed’s Balance Sheet as a way to provide more liquidity to the markets since the Funds rate was locked at the zero bound. The Fed engaged in a massive program of buying UST in what is now called Quantitative Easing (QE.) This program was employed gradually in stages from 2008 to 2015 and resulted in an increase in the Balance Sheet of about $3.5 trillion. Since the middle of 2019 the Fed has bought about $5.0 trillion more of UST securities. This experimental process has become a mainstream policy tool for the Fed. By closing in on their mandate of full employment and with inflation concerns, the Fed has just announced tapering of their $120 billion of securities purchases a month. They will slow their purchases by $15 billion per month. The chart below shows the increase in the Fed’s Balance Sheet as a result of QE.

Source: FRED
Debt Trap
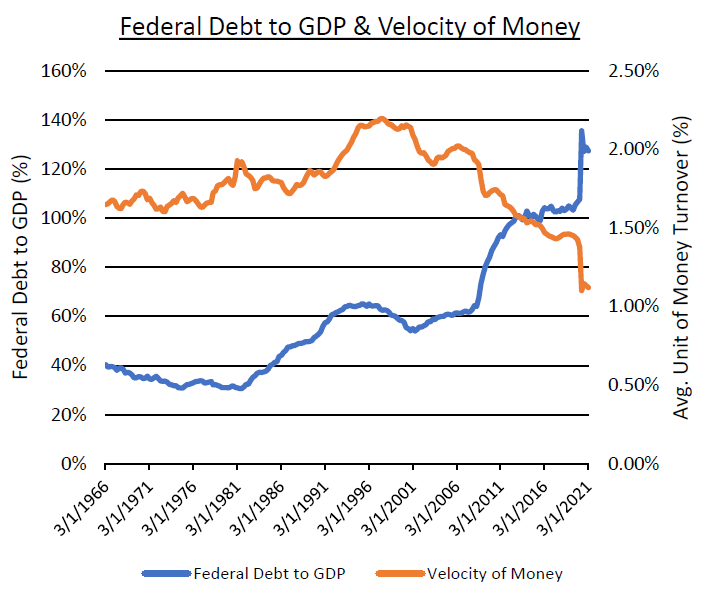
The U.S. economy has become highly leveraged and is overloaded with debt. This is the result of government policies designed to stimulate demand in the economy during periods of economic weakness. Monetary tools have encouraged marginal borrowers to borrow more by reducing the cost of borrowing to very low levels. The problem with this strategy is that borrowing money now to purchase goods and services brings future economic activity into today. This means this stimulus wears off quickly because consumers have already purchased their goods by borrowing money now. When Federal Debt levels as a percent of GDP get over 60% fiscal policies of deficit spending are also a problem for the same reason. The chart below shows the U.S. now has debt levels of about 130% of GDP. This has led to a decrease in the money multiplier which is a measure of the transactions taking place in the economy. The chart also shows the accumulation of Federal debt since the year 2000 has become more unproductive for the economy. It will be difficult for interest rates to rise significantly from these levels because the bond market believes current Fiscal and Monetary policies are unsustainable since they have led to shortages and inflationary pressures.
Source: Bloomberg
Conclusion: Monetary Policy Will Become Less Accommodating in the Future
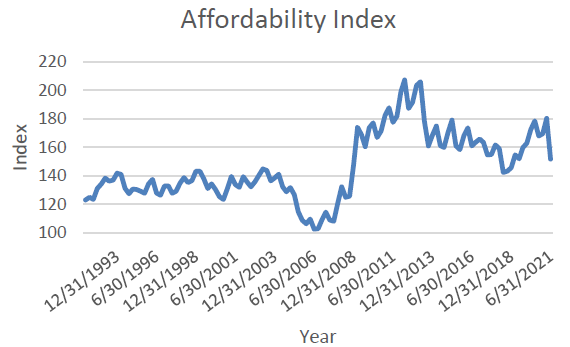
As mentioned above, it was past time for the Fed to begin tapering their purchases of UST. If tapering continues at the current pace, QE is expected to be over by the middle of 2022. There is considerable discussion about when the Fed will begin to raise overnight rates from the zero bound. The Fed is already concerned inflation has not been as transitory as they believed. We continue to look at ways the economy is already slowing down. A good example is the housing market. The chart below shows the affordability index for housing. Prices have risen and so have financing costs which make housing less affordable. We would expect the housing market to continue cooling off due to affordability issues.
Source: Fred
Our base case is that our overleveraged economy will be weaker than expected which will relieve supply chain and inflationary pressures. Rates also need to be viewed in a global context. The final chart shows yields for several developed countries over the curve out to 10 years. Rates in the U.S. are considerably higher than the rest of these countries.
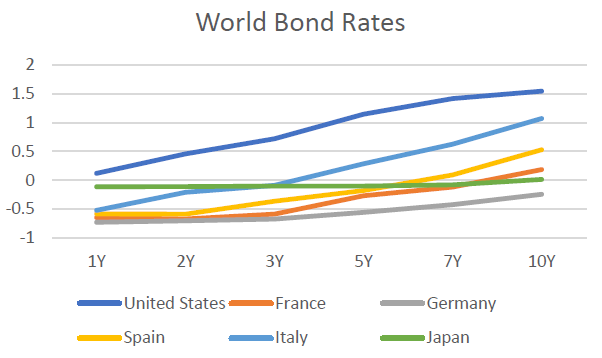
Source: Bloomberg