Fixed income found its footing in the second quarter with many sectors turning positive for the first time this year.
The treasury curve flattened, with yields on the thirty-year treasury declining over 30 basis points to end the quarter at 2.08% while yields on the two-year rose nearly 10 basis points to 0.25%. Municipals and high yield continue their strong performance while high grade corporates and treasuries lag YTD.
Review
The table below summarizes the returns of some fixed income indices:

Debt and the Velocity of Money
The intention of Fiscal and Monetary policies for the last 1.5 years has been to help stimulate the economy and put it on a solid footing. We are increasingly concerned the current policies will not have the desired effect going forward. Policy makers seem to rely on the creation of debt as the only tool in their tool box. The chart below shows debt as a percentage of GDP and the velocity of money. When viewed together, we see what has happened as the U.S. has leveraged its economy. During the period from 1980-1996 the U.S. cut tax rates and increased the amount of debt relative to GDP. The velocity of money also increased which shows that the addition of this debt had a positive effect on economic growth.
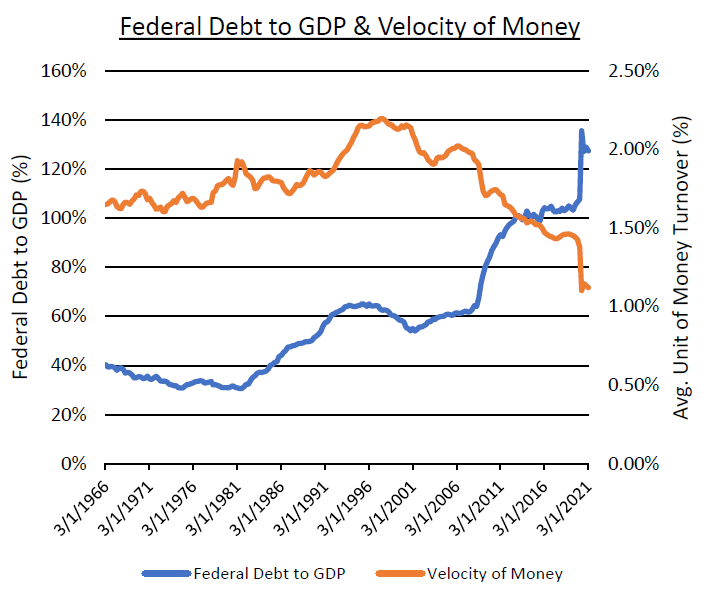
Source: Bloomberg
Since 1996 we have continued to add debt hoping for the same results. This has not happened. Instead, ever increasing levels of debt appear to have a diminishing economic impact. This is shown by the rapid decline in the velocity of money, and recent deficits have only accelerated this trend.
Policy makers need to come up with another policy tool to aid economic growth. When the problem is too much debt, it doesn’t make sense to rapidly increase the rate of borrowing.
Balance Sheet and Job Openings
In addition to taking short term rates down to the zero bound, the Fed has been busy buying $120 billion a month in UST and Mortgages. This is known as Quantitative Easing (QE). This became a policy tool for the Fed during the financial crisis more than 10 years ago and is designed to stimulate the economy by lowering interest rates and increasing the money supply. The chart below shows the Fed’s Balance Sheet has grown from about $4 trillion to about $8 trillion since March of 2020.
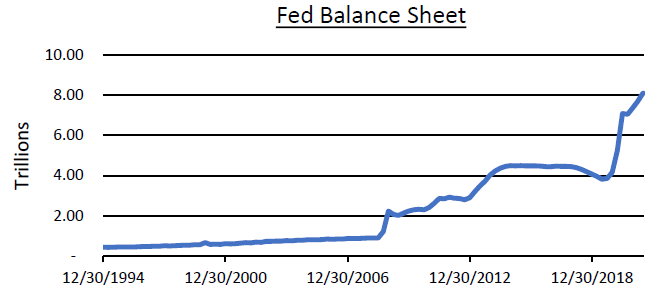
Source: Bloomberg
The Fed has continued this program in spite of supply chain shortages throughout the economy and a record number of job openings. The pace and continued need for these asset purchases is one of the central questions facing the Fed as inflationary forces begin to build in some areas of the economy.
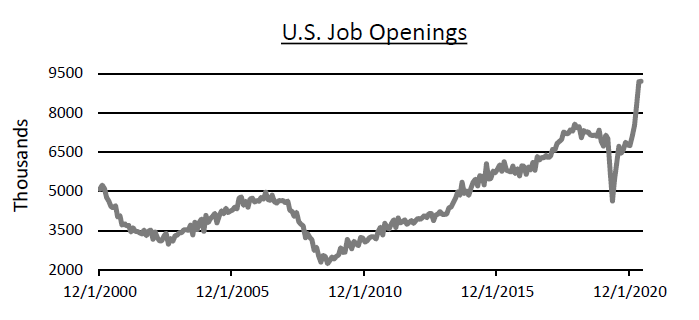
Source: Bloomberg
The chart above shows there are currently over 9 million unfilled jobs in the U.S. This has led to rapid increases in prices throughout many sectors of the economy as employers increase wages to attract workers. Whether or not low rates, quantitative easing, and inflationary forces like wage increases will result in sustained higher inflation remains to be seen.
Conclusion
Fiscal and Monetary policy is still very aggressive. Policy makers continue to do whatever it takes to keep the economic recovery on track. An improving economy, continued quantitative easing, and evidence of building inflation are all likely to put some upward pressure on rates. Structural issues like higher debt levels, however, are a drag on future economic growth and should temper any drastic moves higher.