2024 Q1 Review
The 10-Year Treasury yield saw intra-day declines of 20, 20, and 13 basis points on November 1st, 2023, December 13th, 2023, and January 31st, 2024, respectively. These significant drops, coinciding with Chairman Powell's speeches at the Federal Open Market Committee (FOMC) meetings, represented the most substantial intra-day yield declines in the past nine months. On December 13th, Jerome Powell said, "The next question...is when it will be appropriate to begin dialing back the amount of policy restraint that's in place." The market rally gained momentum as expectations of rate cuts intensified. Driven by a ‘soft-landing’ narrative and reinforced by Fed speak in November and December, a significant bond rally ensued, shaping the end of 2023 and propelling equities to new highs in the first quarter of 2024.
On January 31st, the 10-Year Treasury closed at 3.91% as traders were still trusting in the ‘dot-plots’ and forward guidance that rates cuts were coming soon. Markets had priced in 6 cuts for 2024, with the first one expected in March. Then the incoming economic data began to change, and the 10-Year rose from 3.91% to current levels over 4.30% for new highs in 2024. Stocks continue to set new highs but as we begin Q2 2024, there is increased wariness in the bond markets that rates could go higher.
A Shift in the Outlook
There has also been a shift at the FOMC. As seen in the chart below, the 19 members of the FOMC are split: 9 anticipate a maximum of 2 rate cuts for the year, while 10 committee members project 3 or more rate cuts. While the median rate cuts for 2024 remains at 75bps, dot plots (see below) reflected 4 voting members adjusting their previous estimate upward by at least 25bps. Investors must remember that dot plot projections are not binding for the FOMC. They are simply projections and, historically, they have shown limited reliability. Inflation data and employment numbers remain the north star of the Fed. In our view, until inflation comes down materially or unemployment rises rapidly, there is no rush to lower rates as markets are expecting.
In March, the Federal Reserve’s projection of the neutral rate (where monetary policy is neither stimulative nor restrictive) ticked up slightly from 2.5% to 2.6%. We believe the FOMC may be overestimating just how tight current policy is. Above-the-target inflation, expansionary fiscal spending, a continuously rising deficit, re-shoring, and a continued resilient economy are some of the main arguments for a higher neutral rate. If it is indeed higher, this would also indicate a need to hold current rates higher for longer.
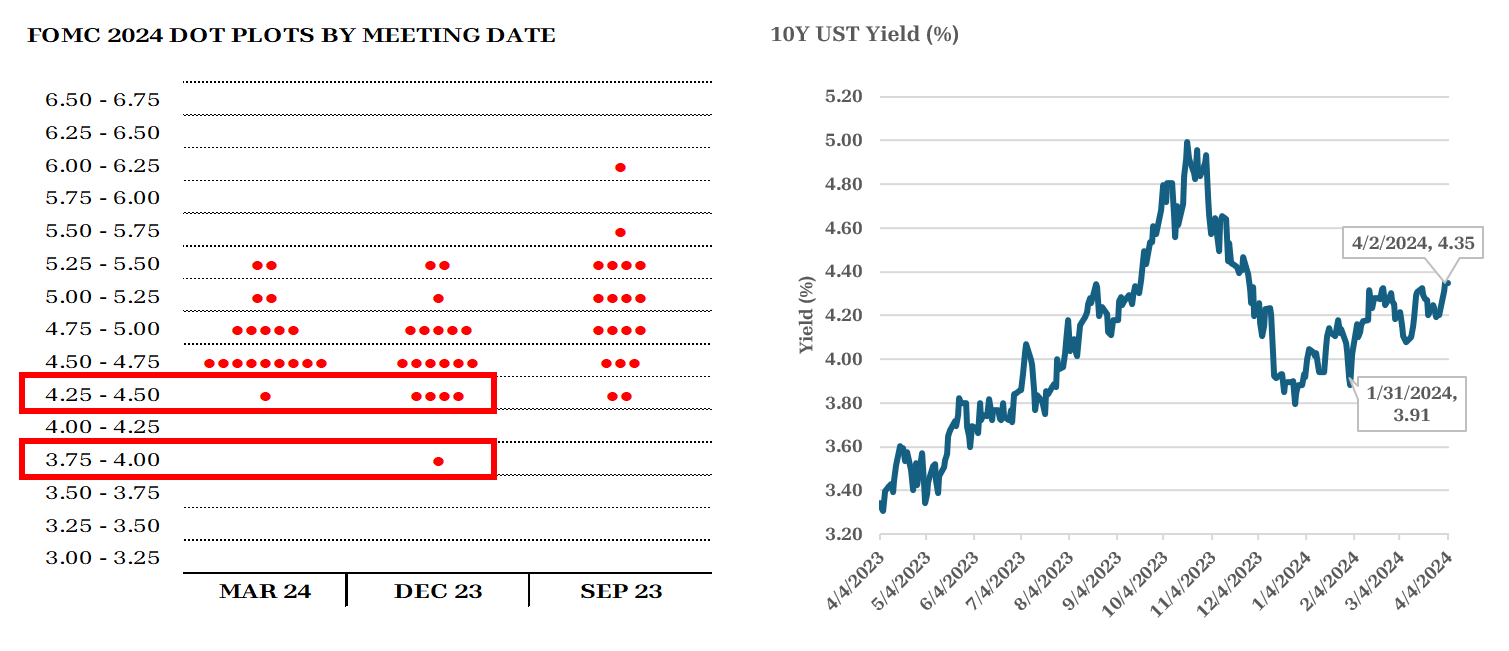
Source: FOMC Summary of Economic Projections, Bloomberg GT10 Govt
How Robust is the Job Force?
Analysis reveals a disparity within the sources of job creation. Strong job growth and low unemployment has kept the markets in doubt about when – or if – a recession will come. So far, total Non-Farm Payrolls data has surprised the estimates, with January and February values coming in at 229,000 and 275,000, respectively. However, since 2023, the healthcare sector, government spending, and leisure and hospitality have supported nearly 3/4 of the nation’s job growth. This could explain why payroll data continues to be strong, even though most employment news is dominated by corporate layoffs.
Of the 23.1% of jobs added by the government sector, 87% of these were added in state and local governments. Looking forward, the question remains if government spending and healthcare will be able to continue adding jobs, or if these sectors will slow like professional and business services have.
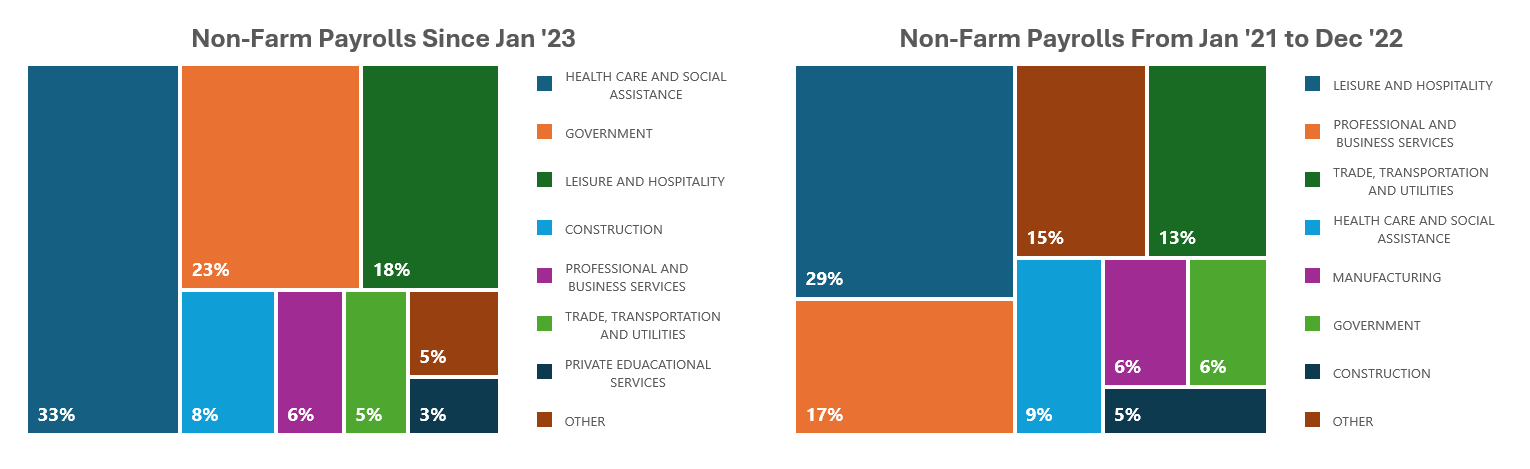
Source: Bloomberg US Economic Data
Sticky Inflation Still Driven By Elevated Housing Costs
Inflation remains above the Fed’s 2% target rate due to sticky housing costs. While Powell attributed the hotter CPI data to “seasonal trends,” it is clear that both core CPI and non-core CPI remain above the 2% target on a year-over-year basis. This has been driven by higher shelter costs, which hold a 34% weighting in the Consumer Price Index. While there has been a notable decline since June 2023 in shelter costs, the same underlying factors remain – elevated rents and high ownership costs. Rental price increases are following the population shifts to the Sunbelt, exemplified by the rapid rent growth of Dallas compared to slowing growth of NYC. As for homeownership, the “lock-in effect” and high mortgage rates keep many Americans outside of ownership – which will likely persist throughout 2024.
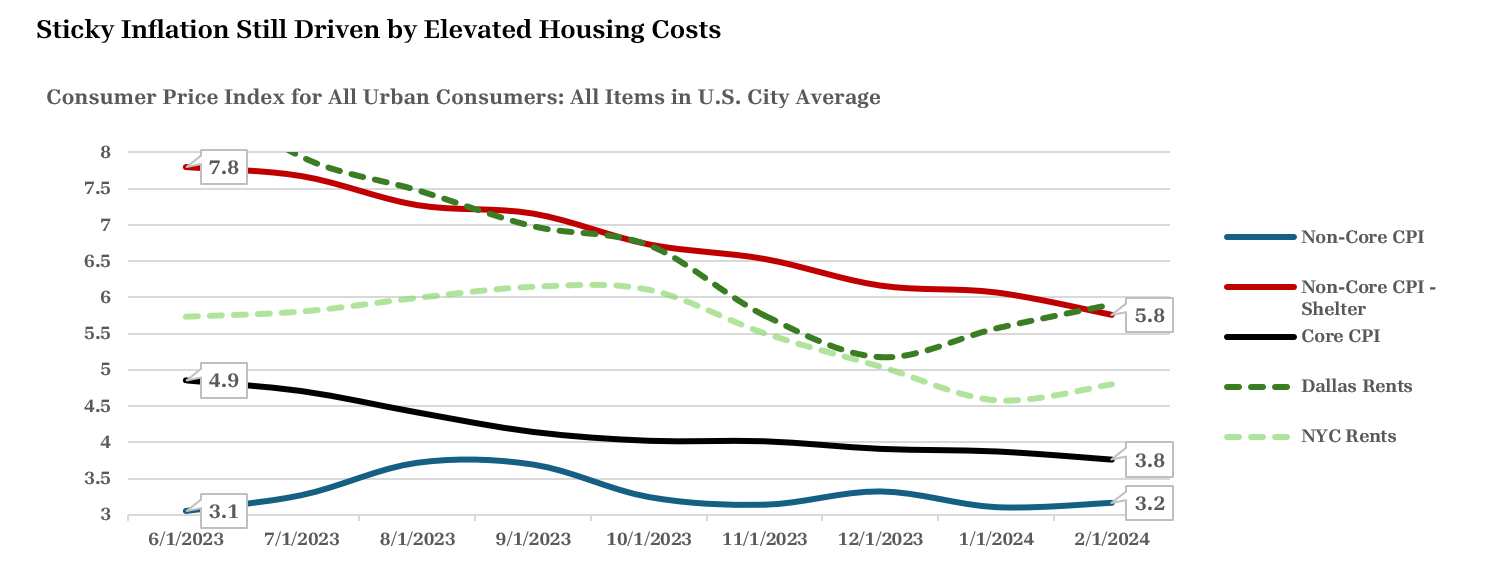
Source: U.S. Bureau of Labor Statistics
National Debt Remains a Crisis with Interest Expense Rising Further
Excess fiscal spending and a mounting deficit will continue to be a headwind for the economy. National debt stands at $34 trillion – a record number despite the fact we are in a peacetime era. Since 2019, the US Treasury market has grown by more than 60%, and it is currently 6 times higher than before the GFC. The graphic above illustrates the nation’s current levels of debt, as well as monthly deficits since January 2023.
Simultaneously, the amount of bills maturing within one year or less has risen above the 20 percent threshold set by the borrowing committee. As of February 2024, the average interest rate on total marketable debt is 3.259%– well below the current Fed Funds rate level of 5.25 – 5.5%. The Congressional Budget Office (CBO) estimates that the US deficit will grow at an increasing annual rate, which must be funded at debt costs more than 200bps above the current average.
The chart above displays the CBO’s long run projection of annual US net interest expense and public debt as a percentage of GDP. By 2034, the public debt as a percentage of GDP is expected to reach 116 percent; these would be record levels. Unless the federal government can reel it in, the nation will be facing unparalleled debt levels and debt servicing costs, which will surely have significant impacts on the economy and markets.
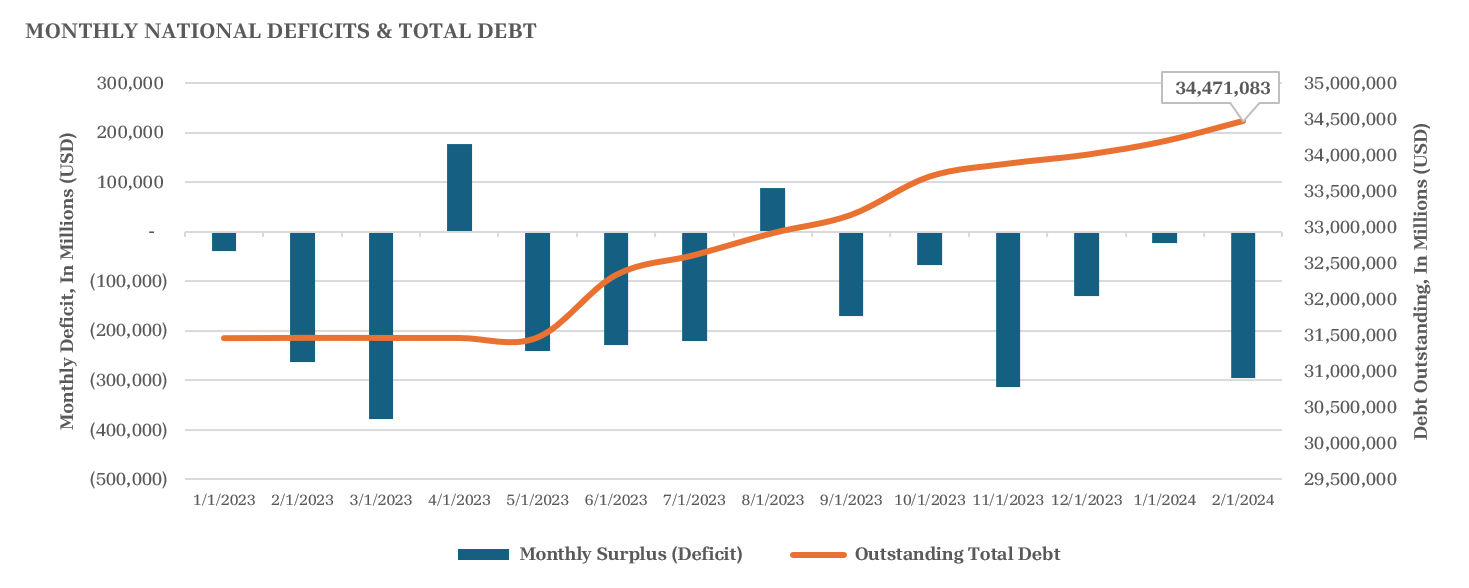
Source: FRED Economic Data

Source: Congressional Budget Office, The Budget and Economic Outlook: 2024 to 2034
Munis Trading Rich
AAA Munis are trading on a richness level not seen in nearly two years. The AAA Muni Yield as a percentage of the UST Yield Index is an effective measure for richness of Munis prices. A lower percentage indicates Munis have rallied relative to UST, while a higher percentage indicates Munis have been discounted relative to UST.
This indicates strong investor demand for Munis, due to their attractive tax-equivalent yields (TEYs) and relatively low credit risk. This provides pricing support for current Muni bond holders, but more importantly, the dramatic rise between 10Y and 30Y Muni ratios displays the benefit of longer-duration portfolios.
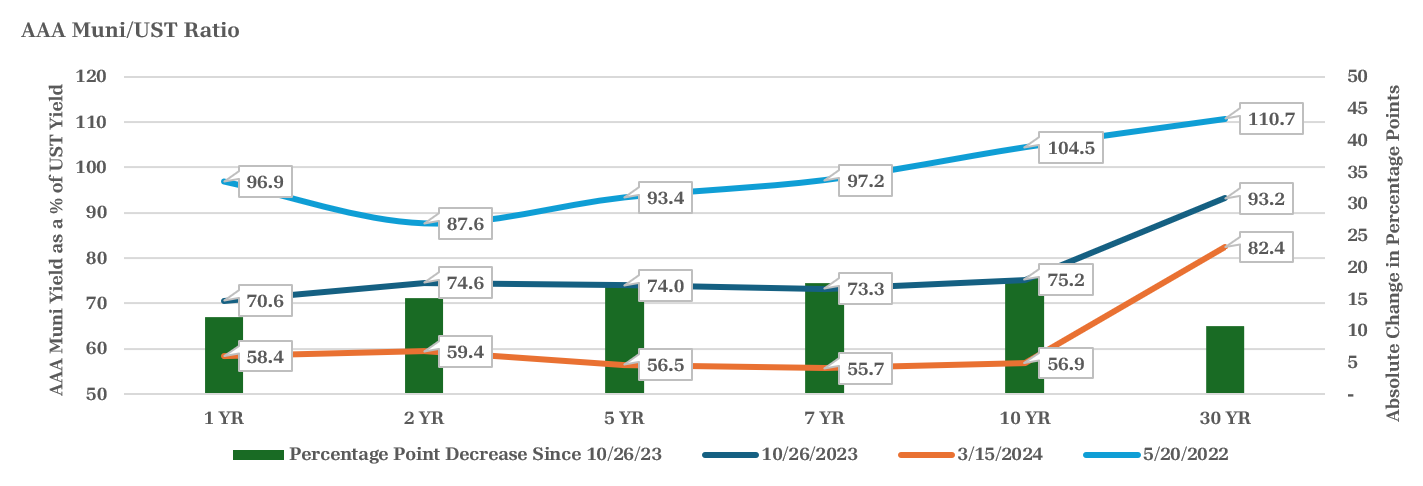
Source: Bloomberg AAA Muni as a % of UST
Benefits of the Barbell Strategy
By positioning portfolios in a barbell strategy, we can pick up additional yield compared to the BVAL AAA Muni Curve. As the U.S. Treasury yield curve remains inverted, we are continuing to avoid the “belly” of the curve. The “belly” is where yields have dropped to the point that there exists no yield compensation for duration risk. With the barbell strategy, we have a percentage of the portfolio longer in case yields fall and a percentage of the portfolio short in case yields rise. This ensures our clients are not stuck in the “belly” in lower yields.
The illustration below shows our recent buys over the first quarter of 2024 compared to market yields. On average, we were able to purchase bonds approximately 107bps higher than the curve. Assuming a 37% federal tax rate, the average tax-equivalent yield for our buys was 6.47%. Past performance is no guarantee of future results, but we were pleased with our purchases from 1/1/2024 - 3/31/2024.
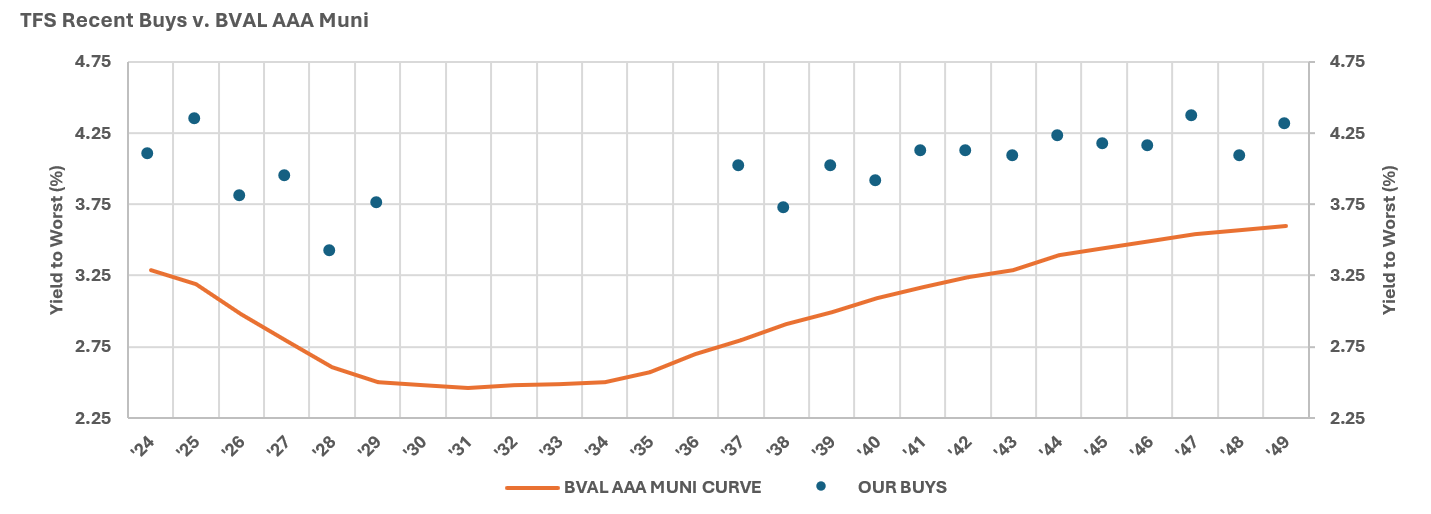
Source: Bloomberg BVAL AAA Muni Curve as of 3/31/2024
Credit Protection
Munis are a great choice for investors looking to diversify away from corporate credit risk. Each year, S&P Global Ratings releases default rate studies for global corporates and U.S. public finance. These studies include all investment grade and speculative bonds in the S&P universe. As such, default rates provided do not include issuers not rated by S&P, nor do they include non-rated municipals and corporates. During 2023, there were 153 total global corporate credit defaults - the US represented 96 of these defaults. All but two of these defaults were among speculative-grade (BB+ and lower) issuers, with Silicon Valley Bank and its holding company being the two investment grade defaults.
On the other hand, municipal bonds continued to show credit strength in a similar fashion to years prior. In 2023, only 4 total issuers defaulted – all four of which being speculative-grade issuers. The illustration below demonstrates the current yield-to-worst of the Bloomberg indices for U.S. Treasuries and U.S. Corporates compared to U.S. Municipals. With current yields, investors can pick up higher after-tax yields while maintaining better credit protection. This is especially valuable for individuals in high tax states (NY or CA), or those wanting additional protection against credit risk in a higher rate environment.
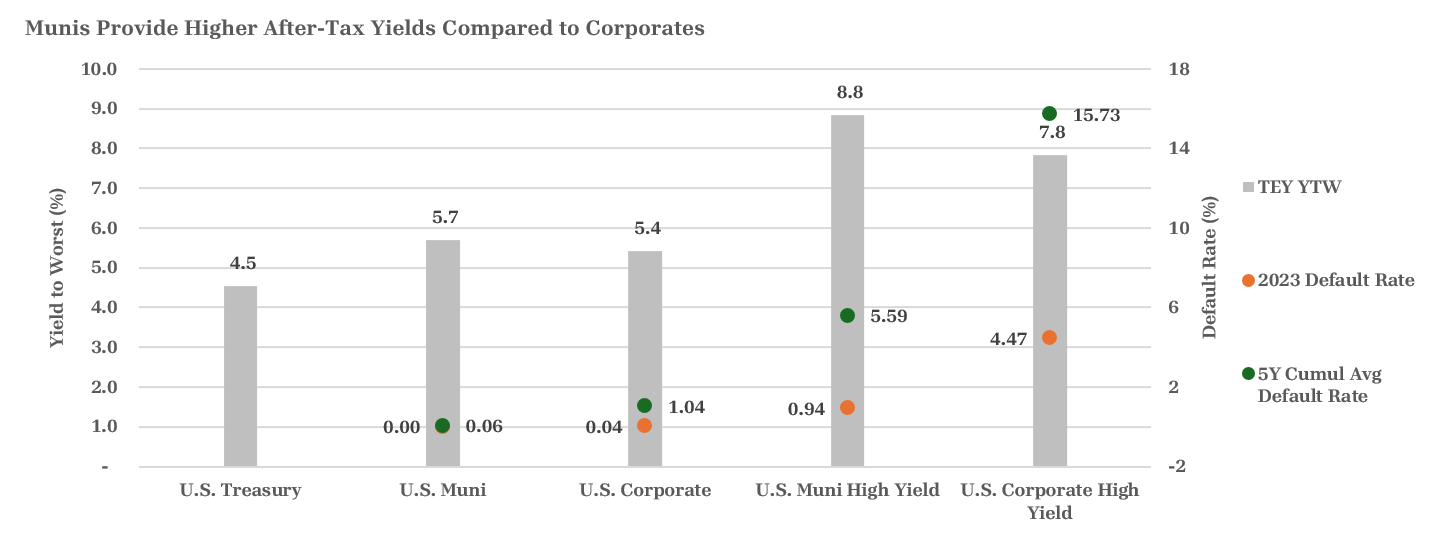
Source: S&P Global Ratings: 2023 Annual Global Corporate Default and Rating Transition Study, S&P Global Ratings: 2023 Annual U.S. Public Finance Default and Rating Transition Study, Bloomberg BVAL Indices
Rating Upgrade/Downgrades
Additionally, nearly all municipal sectors experienced positive rating actions. The chart below displays the upgrades, downgrades, and defaults for each specific municipal sector during 2023.
Transportation: This was the brightest sector for municipalities in 2023, thanks to improvement across major U.S. airports and new highway infrastructure built to support shifting population trends. Moving forward, we expect these trends to continue, especially as counties within the Sunbelt region of the U.S. grow above the national average.
Local Government: Many local governments continue to remain in a healthy financial position, thanks to reserve programs provided by the federal government. As some of this aid rolls off over the next two years, we will monitor which local governments are able to readjust to normal budgeting levels.
Healthcare: The area with the most downgrades, this continues to be a sector we are monitoring closely. Many hospitals and senior care facilities are facing operating pressures related to higher labor costs and concentrated payer mixes. We found that health care issuers with sizeable market share in medium to large metropolitan areas can navigate these challenges easier. Looking forward, we believe there may exist some attractive entry opportunities for health care credits that are discounted below fair value.
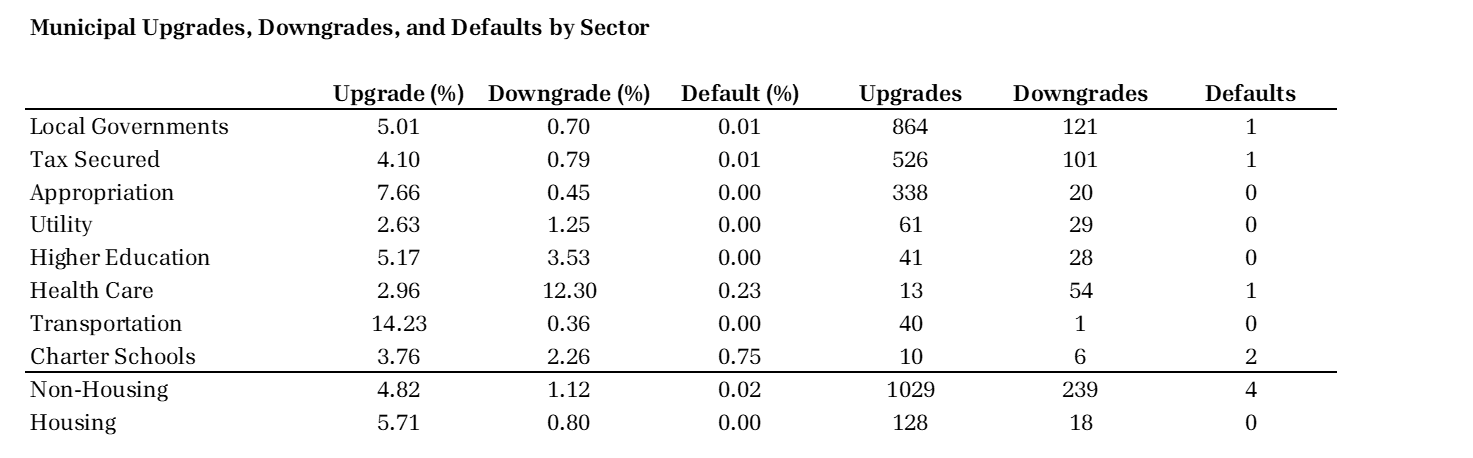
Source: S&P Global Ratings: 2023 Annual U.S. Public Finance Default and Rating Transition Study
Conclusion
So far, the Federal Reserve has remained committed to the 2% inflation goal. Core PCE is 2.8% and Core CPI remains at 3.8%. While the 19 members of the FOMC are split on how many cuts we will see this year, we are firmly in the ‘2 or less camp’ while the economy remains strong. We believe it will take at least 2-3 months of continuous encouraging data before the Fed will feel comfortable cutting rates. If the Fed cuts rates too soon, this could trigger adverse effects for inflation, especially for housing costs. If they move too slow, they could find themselves behind on a rising unemployment rate. Moving forward we will continue to monitor the US fiscal policy, as mounting debt and rising net interest expense will create headwinds for the economy in the long term. We believe mixed data will continue to come in this year, causing the Fed to be more patient than markets are hoping.
With a potential higher neutral rate and inverted yield curve, we believe an intermediate barbell strategy is best for Municipal Bond investors right now. With potential economic uncertainty ahead, we continue to believe municipalities are an attractive asset class providing stable cash flows and favorable tax treatment.