2022-2023 Review
The past 2 calendar years have been eventful years for the U.S. and for financial markets. Coming out of COVID, we have seen massive shifts in global supply chains, inflation, interest rates, consumer sentiment and consumer spending. We hope we are never in a position again like we were during the pandemic. Below are some of the shifts we have seen over the past 24 months. Arguably, the 6 sets of numbers below have shaped our economy and will continue to shape 2024 and where we go from here.
As seen below, the upper bound Federal Funds Rate rose from 0.25% to our current level of 5.5% to fight rising inflation. Because of this rise, Core CPI and Core PCE have almost been cut in ½ from where we were in the beginning of 2022. The 10-Year Treasury began and ended 2023 at the same levels despite touching 5% in October of 2023. This rise in rates also cooled the housing market. 60% of homeowners are locked into rates below 4%, leading to a lack of supply as mortgage rates skyrocketed to nearly 8% and ended the year at 6.99% (Bankrate.com). Demand is now picking up as rates have fallen but the continued lack of supply could be a headwind for inflation making its way all the way down to the Fed’s inflation target.
Throughout all of this, the unemployment rate fell from 4% to 3.7%. The economy has remained strong and the consumer has remained resilient, allowing the Fed to have a single mandate in combatting inflation. While debates rage on about how many cuts we will see in 2024, we continue to monitor the unemployment rate carefully as this will be one of the strongest influencers of how 2024 continues.
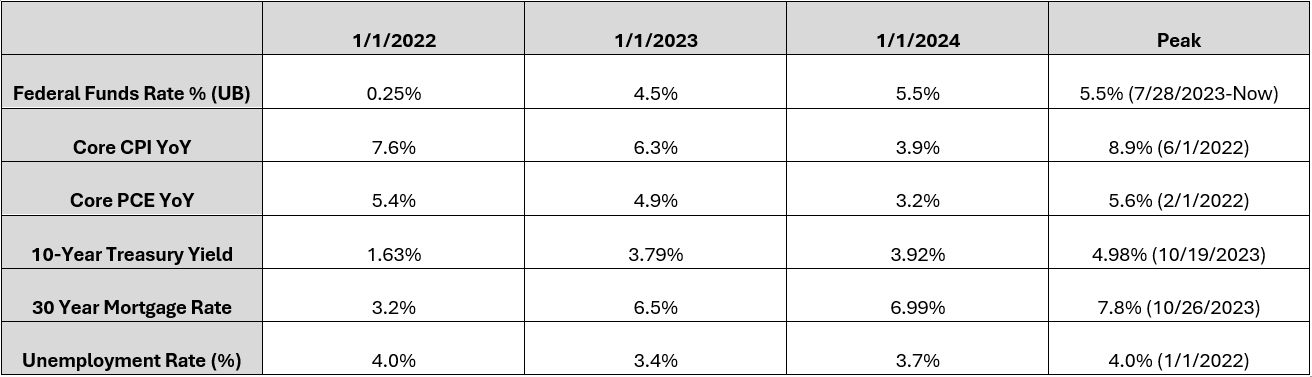
Source: Bloomberg
Municipal Finances in Good Shape
State and Local Obligations: Credit conditions for most Munis are stable. The massive Federal deficits since 2020 and an improved economy have helped cities and states shore up their finances sigificantly. There has been funding support through a variety of programs such as the American Rescue Plan passed in March 2021. This plan provided $579.4 billion in funding which was divided into funds for States, Local Government, School Districts, Healthcare, Higher Education, Airlines, Airports and Mass Transportation. This was in addition to previous Muni handouts of $109.5 billion in the December 2020 Stimulus plan and $412.5 billion from the CARES Act. This amounted to more than $1.1 trillion of Federal aid for Municipalities. A significant portion of these funds have helped these governments with infrastructure spending and budgetary improvements. S&P recently published “U.S.States 2024 Outlook: Credit Stability In Unstable Times.” In this outlook they discussed the improvement in “Rainy Day” fund balances since the Financial Crisis 15 years ago. The chart below shows States fund balances as a percentage of their budgets has more than tripled since 2015. This means States are adequately prepared to weather a possible downturn in the economy and potential reductions in Federal funding support as Congress seeks to gain control over their spending.

Source: S & P
Sector Analysis: Examples
In our “Bottom Up” approach to building tax-free bond portfolios we realize some sectors have better credit profiles than others. Here are some sectors that we like right now and one example of something we are avoiding.
Charter Schools: We like Charter Schools in Charter School friendly states. We look for a 10 year or longer track record, good test scores, significant wait lists, strong governance, and increasing enrollment trends. This sector has positive enrollment trends. The chart below shows the positive trend for growth in Charter Schools in Arizona compared to the growth in enrollment in Public Schools. While Public school enrollment has fallen slightly, Charter School enrollment has risen from 134,705 in 2012 to 232,663 in 2023. While many schools in this sector are rated less than investment grade, we like bonds that participate in the Arizona Charter School Enhancement Program. These bonds are AA- rated and the program is currently at capacity. Further, as these credits are investing in our children, we believe these high-quality schools have great purpose and good public backing.
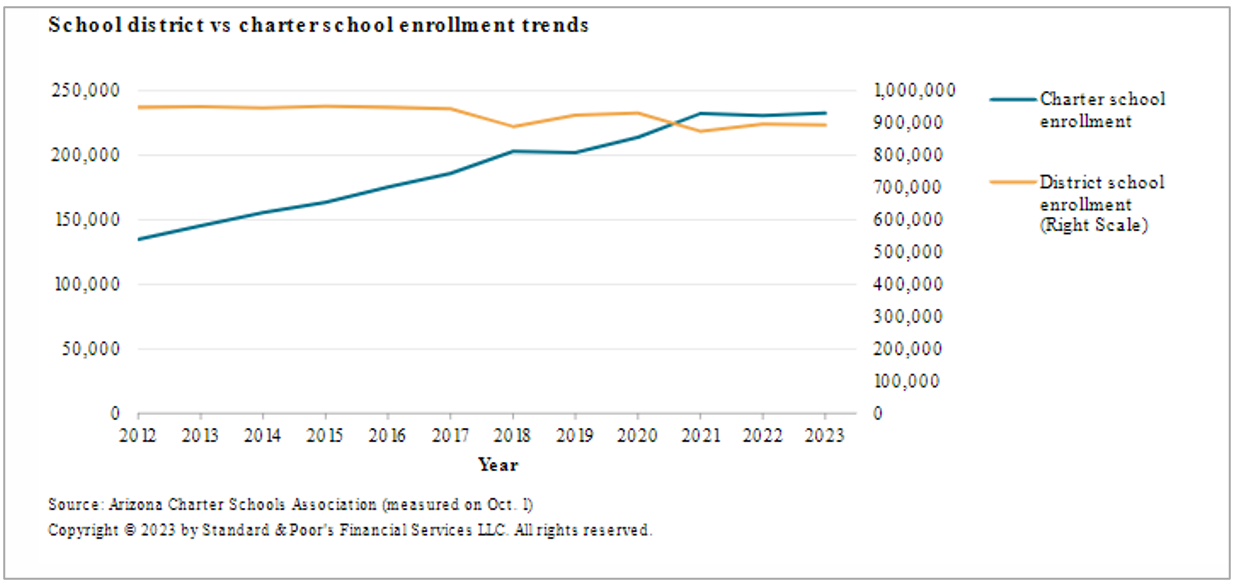
Source: S & P
Sector Analysis: Examples
Municipal Utility Districts: Texas Municipal Utility Districts have a very favorable risk profile. The chart below from S&P shows 200 rating upgrades during the last 2 years compared to 1 rating downgrade. Most of these issues are also wrapped with bond insurance to give them a AA rating. Texas, unlike some other states, also has a growing population which brings a wider tax base. This is one sector that we were focused on in 2023 and brought clients have been rewarded with how they have performed.
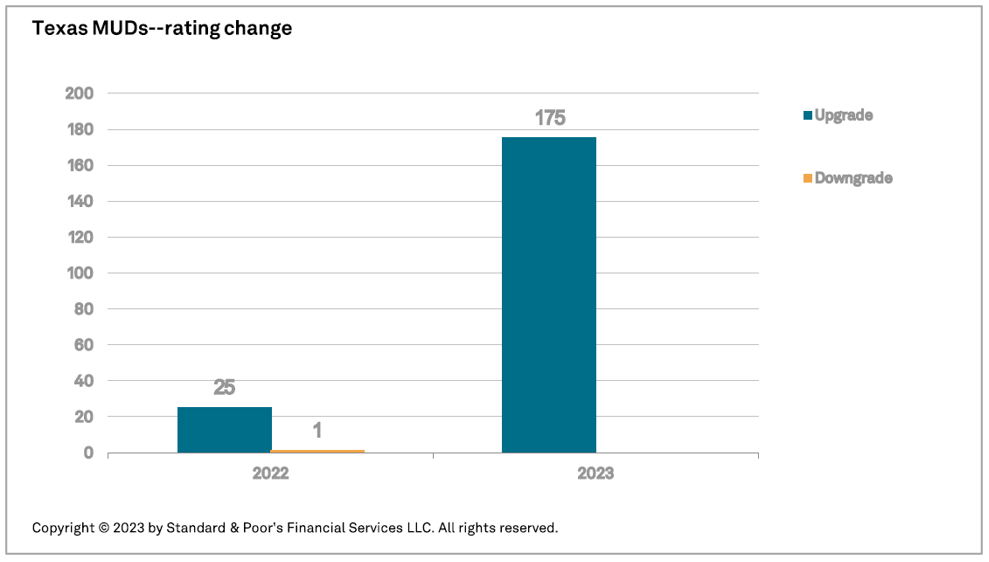
Source: S & P
Higher Ed: One example of something we are avoiding is smaller liberal arts colleges. Many of these schools have declining enrollment, high tuition costs, and some of them have even closed their doors during the last few years. The Higher Education sector is experiencing oversupply, higher costs due to inflation, high tuition and housing costs for students, negative geographic trends affecting enrollment, and a student loan borrowing stigma acting as headwind for this sector.
Portfolio Structure: Barbell Strategy
The first chart below shows the yield curve from 1 to 30 years for a AAA rated Muni bond. The curve is inverted from 1 to 16 years and is steep on the longer end. The structure of this curve lends itself to a barbell strategy, rather than a typical Muni bond ladder. The barbell consists of some bonds in the higher yielding shorter maturities and some bonds in the 15-to-20-year area. The bonds in the longer bucket provide an income component to lock in the higher yields that are currently available. There is an emphasis on bonds with good call features which help protect the income stream. The shorter bonds provide liquidity and dampen the volatility of the fixed income portfolio. These bonds are also helpful to manage the duration of the portfolio to an appropriate level depending on the risk preferences of each individual client.
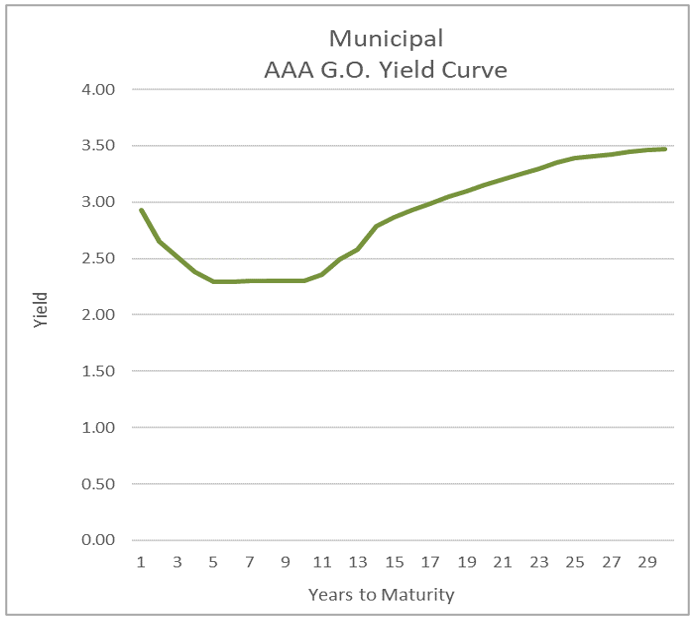
Source Bloomberg
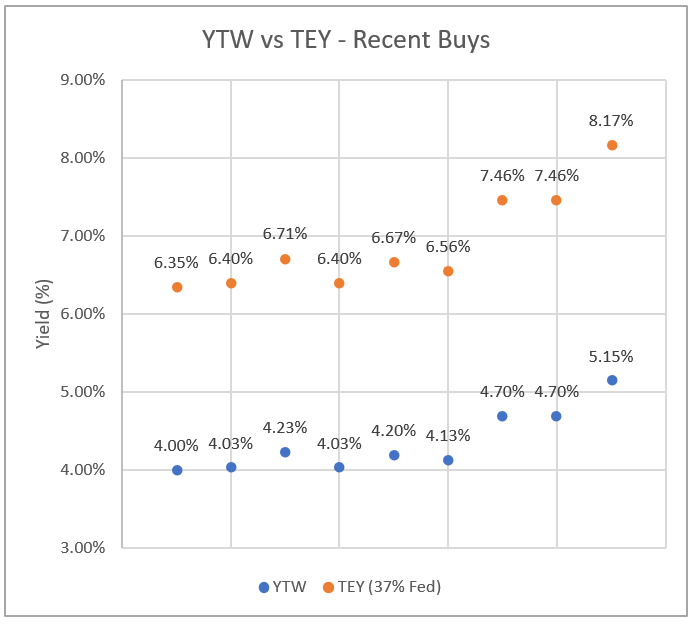
The chart above shows the yield range where we have been buying bonds above 4% Tax-Free. The Blue dots show ‘Yield-to-worst’, and we typically aim to buy bonds at attractive levels above the AAA curve. The orange dots above show the tax-equivalent yields if in the 37% tax bracket and does not account for state taxes, which would make them even higher yields. Even though off peak rates, we believe muni bonds remain attractive for investors.
Conclusion: Goldilocks Economy?
The markets have discounted the following:
1.) Inflation is now under control and will easily get back to the 2% target.
2.) The Dot Plots, which show possible cuts beginning in mid-year are too conservative and will begin earlier.
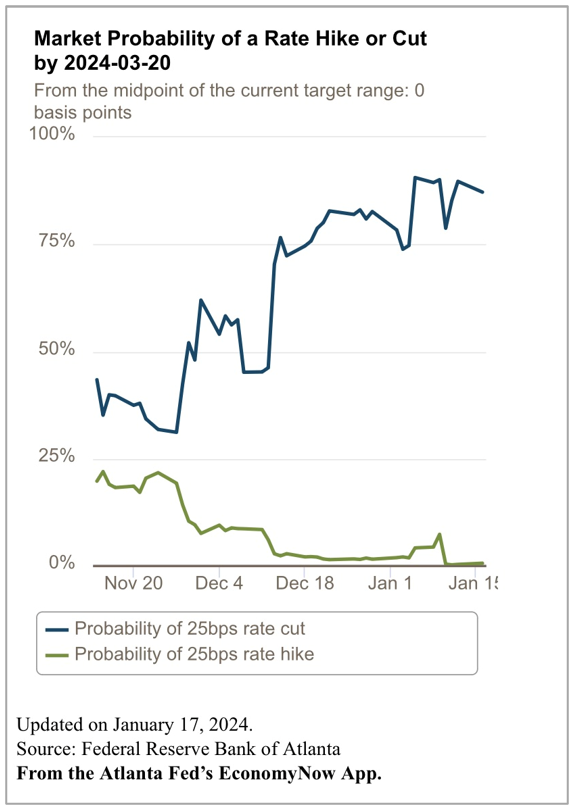
3.) The Fed will soon begin to cut interest rates. The chart below from the Atlanta Fed shows the odds to be about 80% that the Fed will begin cutting rates by 3/20/2024. Overall, the market is expecting 6 cuts this year.
4.) The Fed will generate a “soft landing” for the economy, and we will avoid a recession.
5.) Stocks and bonds can only go up from here.
Source: Atlanta Fed, EconomyNow App